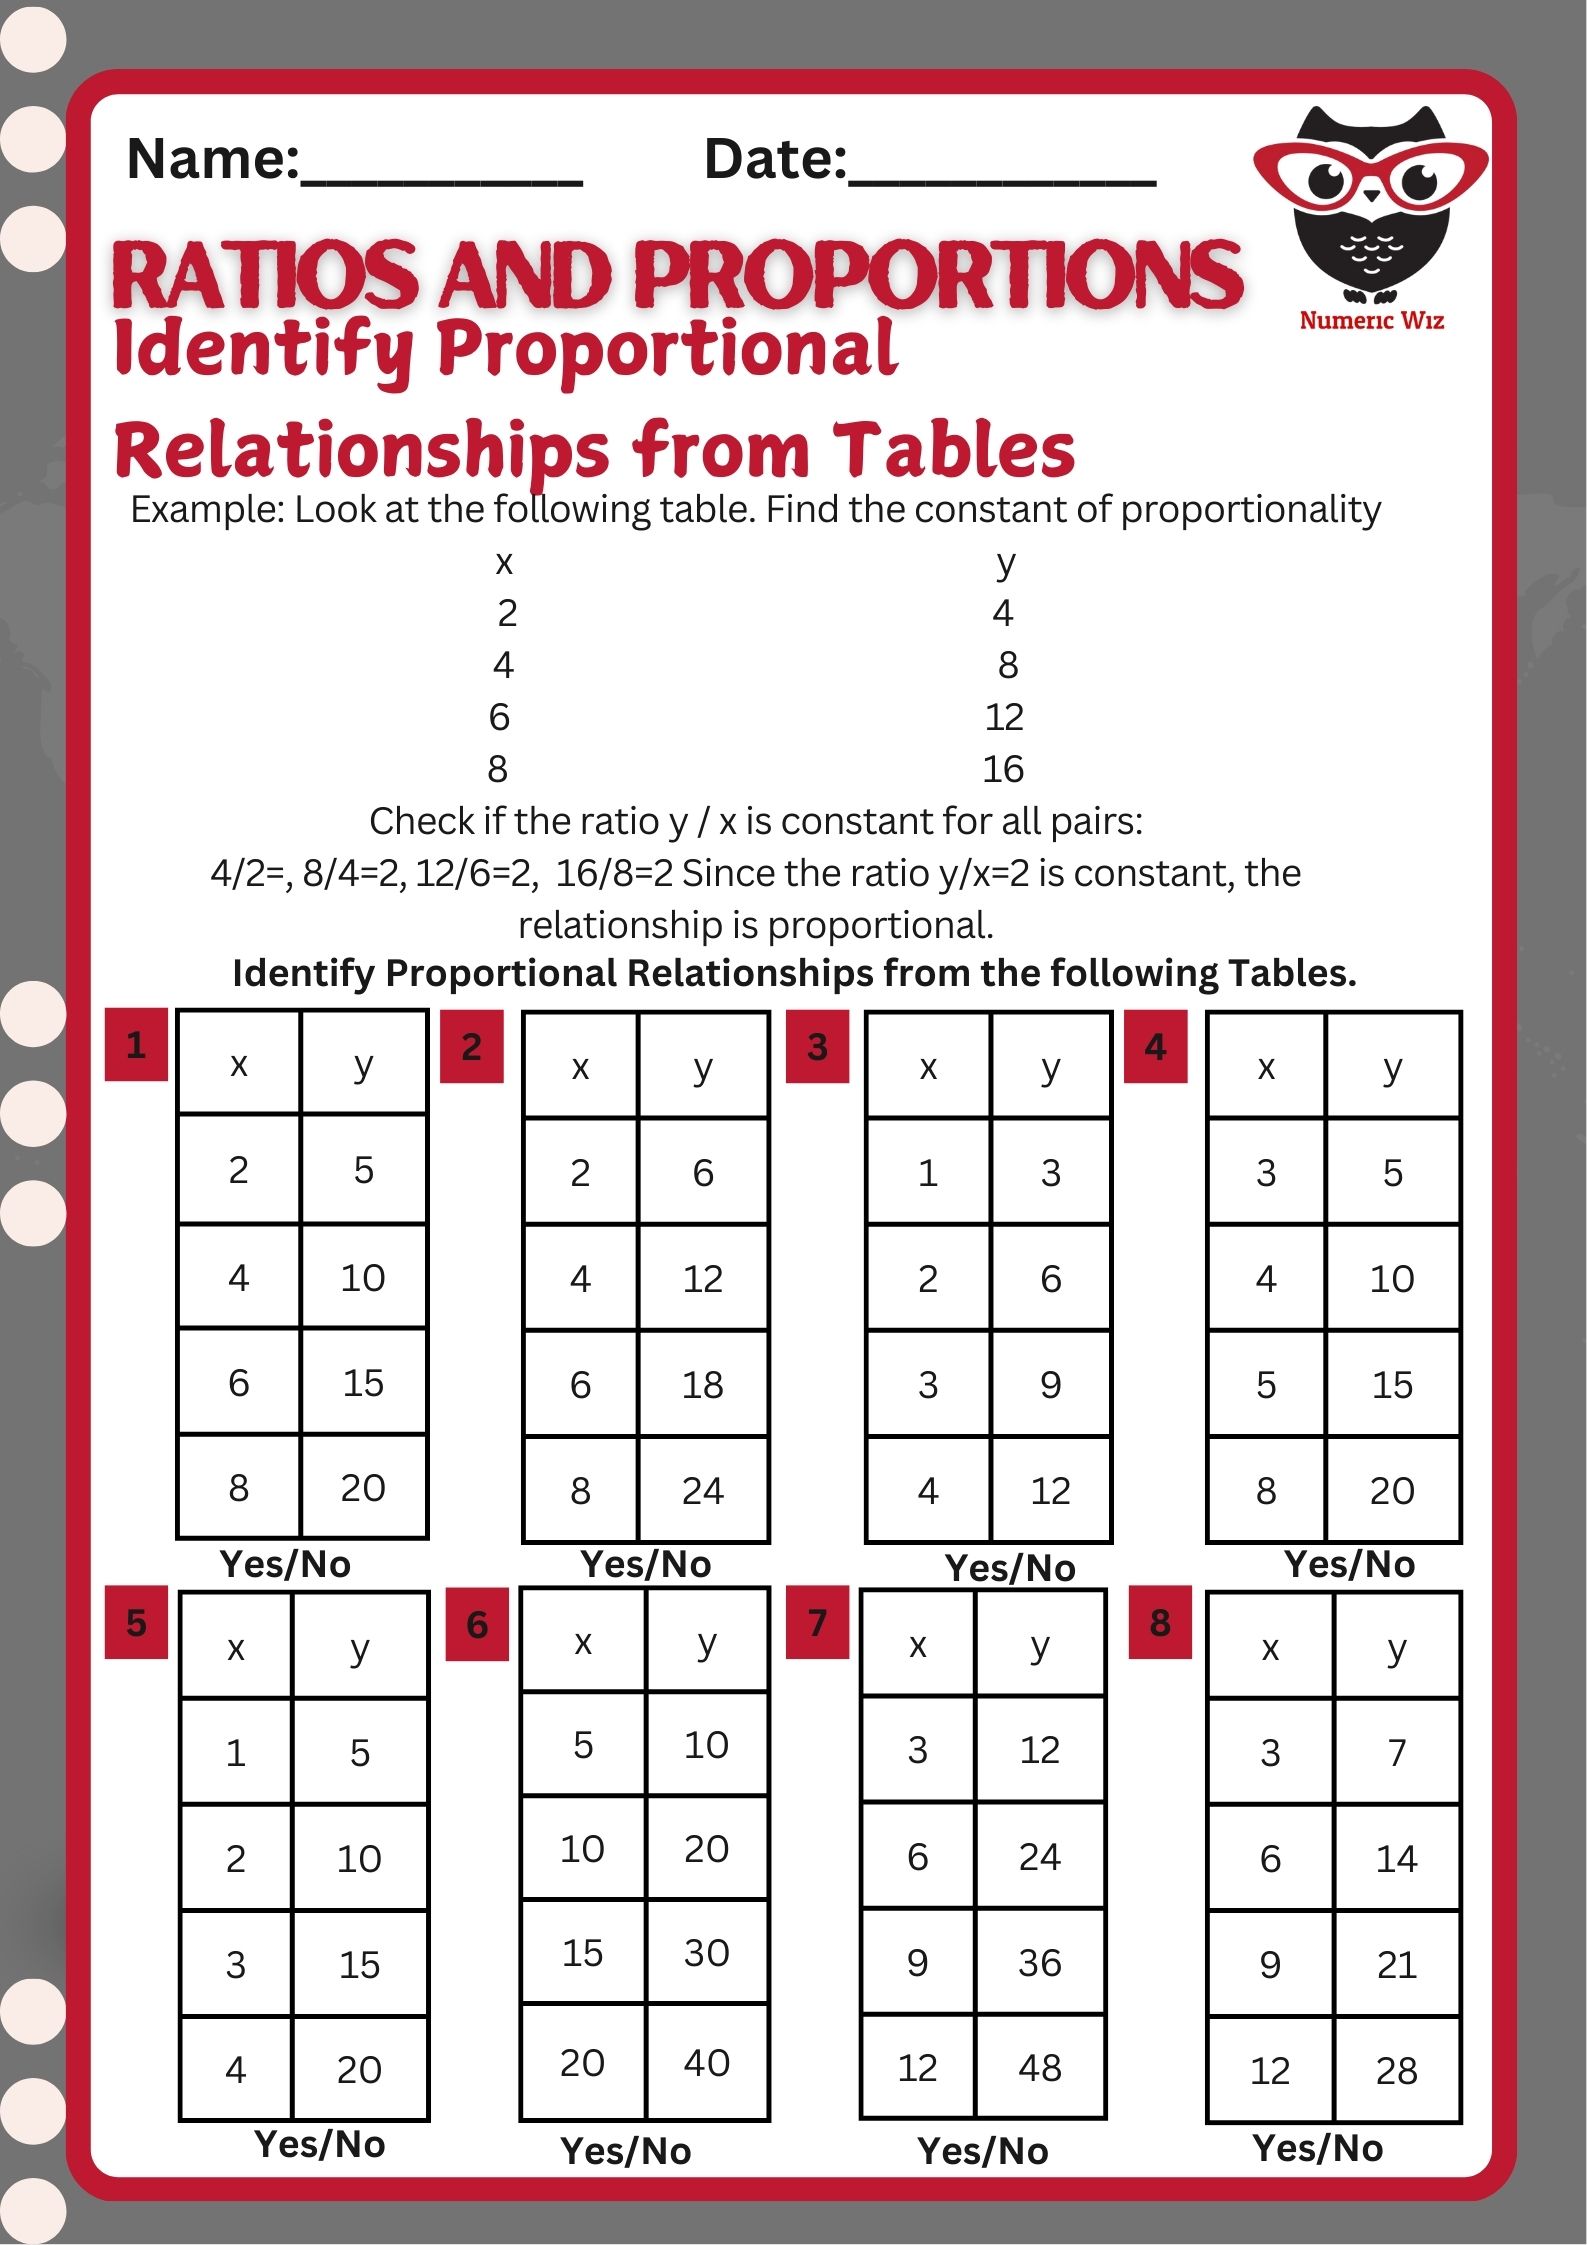
This engaging worksheet helps students dive into one of the most important concepts in proportional relationships — the constant of proportionality (k). By using graphs and coordinate points, learners will practice finding the value of k, which tells us how two values are related in a consistent, proportional way.
Perfect for visual learners, this activity builds a strong foundation for working with equations like y = kx and understanding proportional patterns in real life.
How to read coordinate points from a graph.
How to calculate the constant of proportionality (k).
How to use the formula k = y / x (when y and x come from a proportional pair).
How to apply the concept of unit rate in a real graph-based setting.


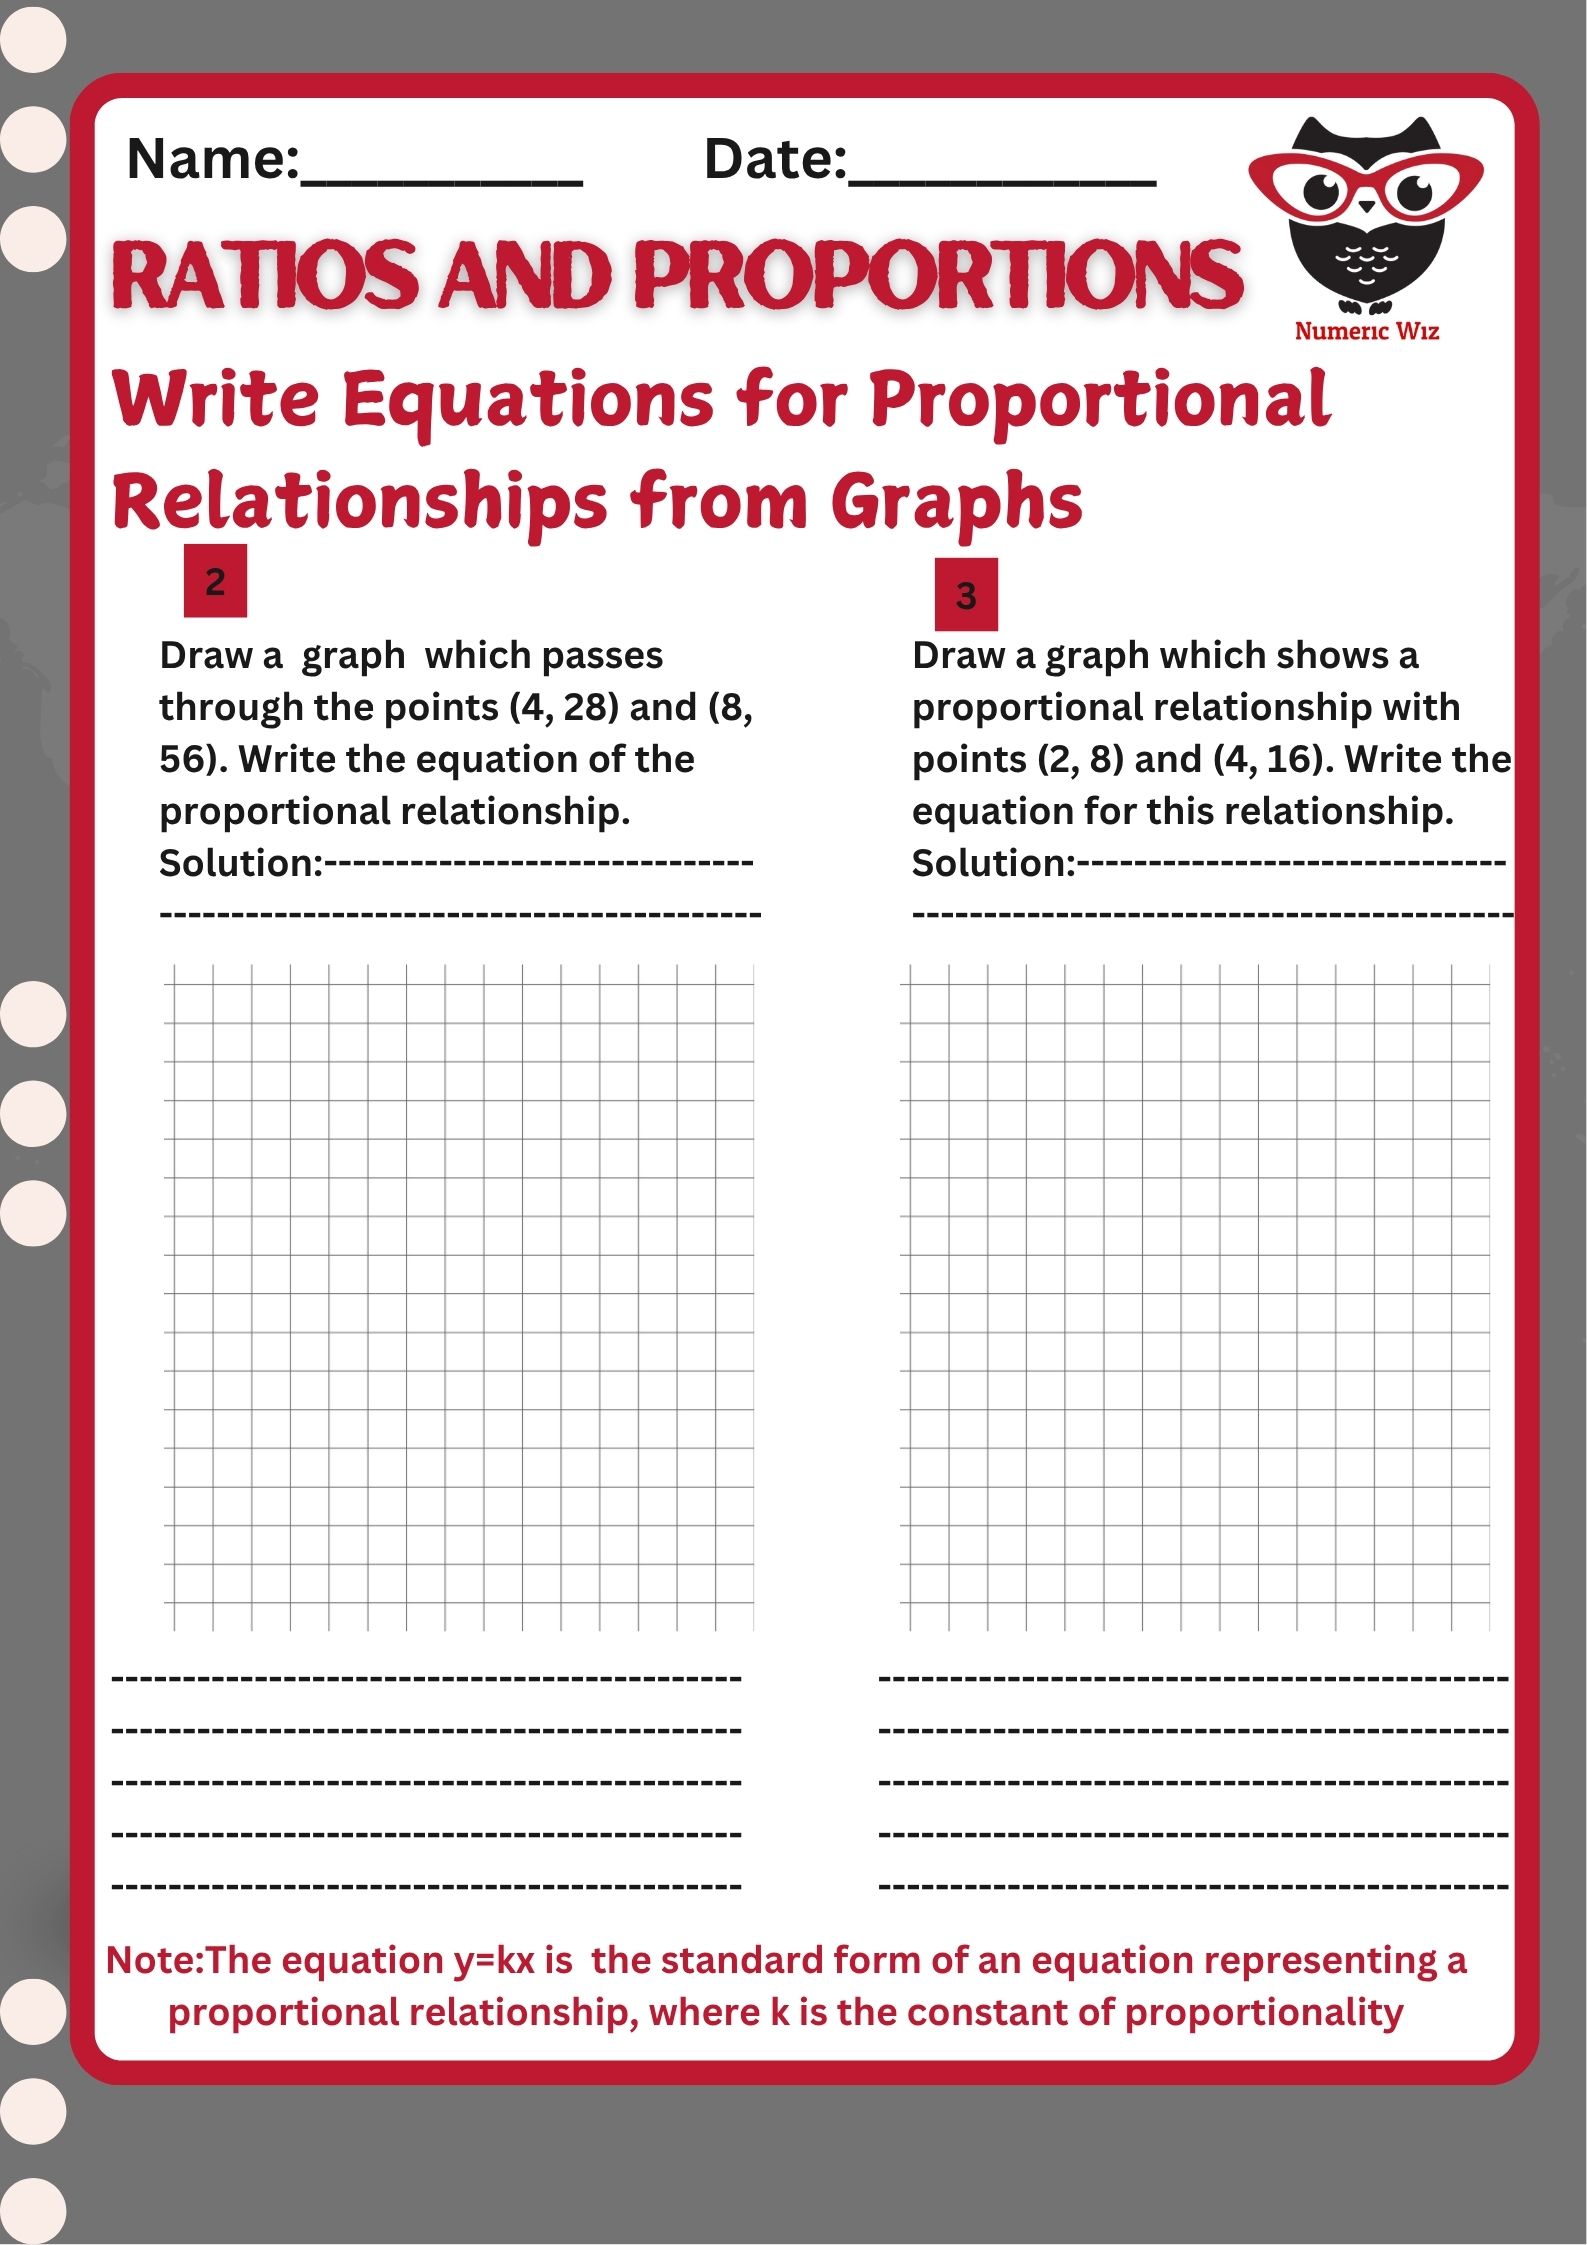
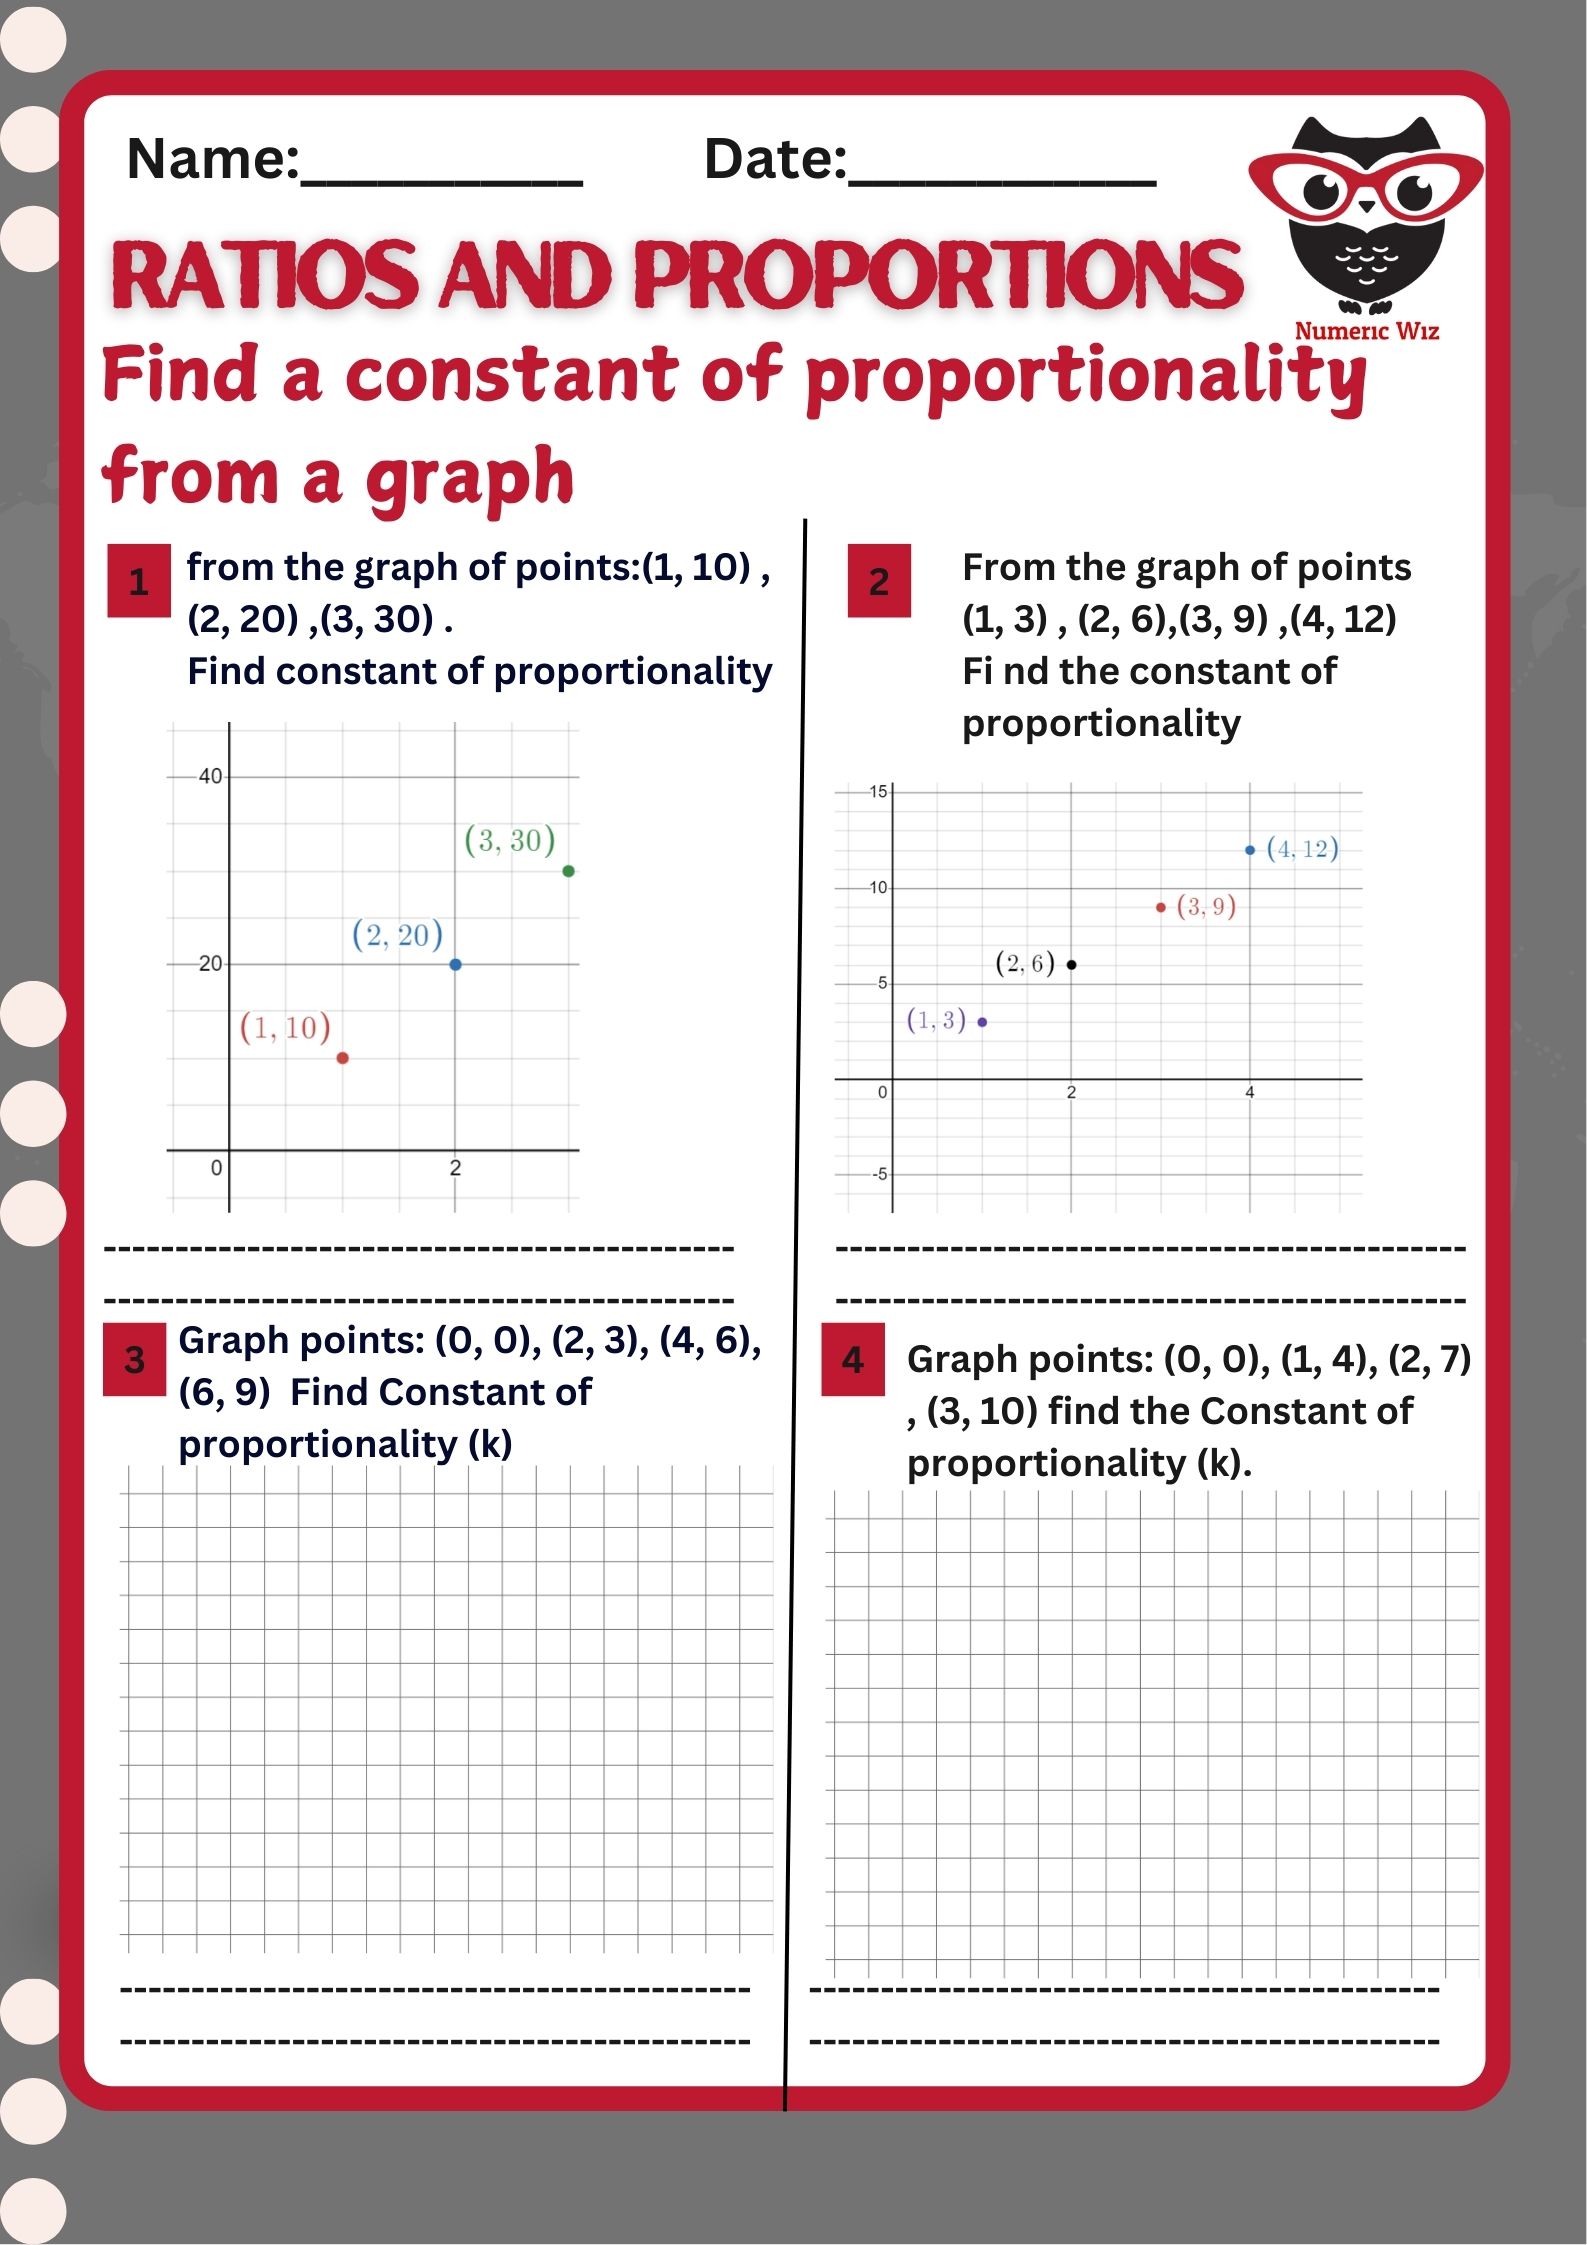
Choose any point from the graph, e.g., (2, 20).
Use the formula:
k = y / x = 20 / 2 = 10
Check other points to confirm:
(1, 10) → 10 / 1 = 10
(3, 30) → 30 / 3 = 10
So, the constant of proportionality (k) = 10
Q2: Use points like (3, 9), (4, 12) from the graph. Apply the same method: k = y / x
Q3 & Q4: No graph given? No worries! The points are listed, so students must plot them or just plug into the formula.
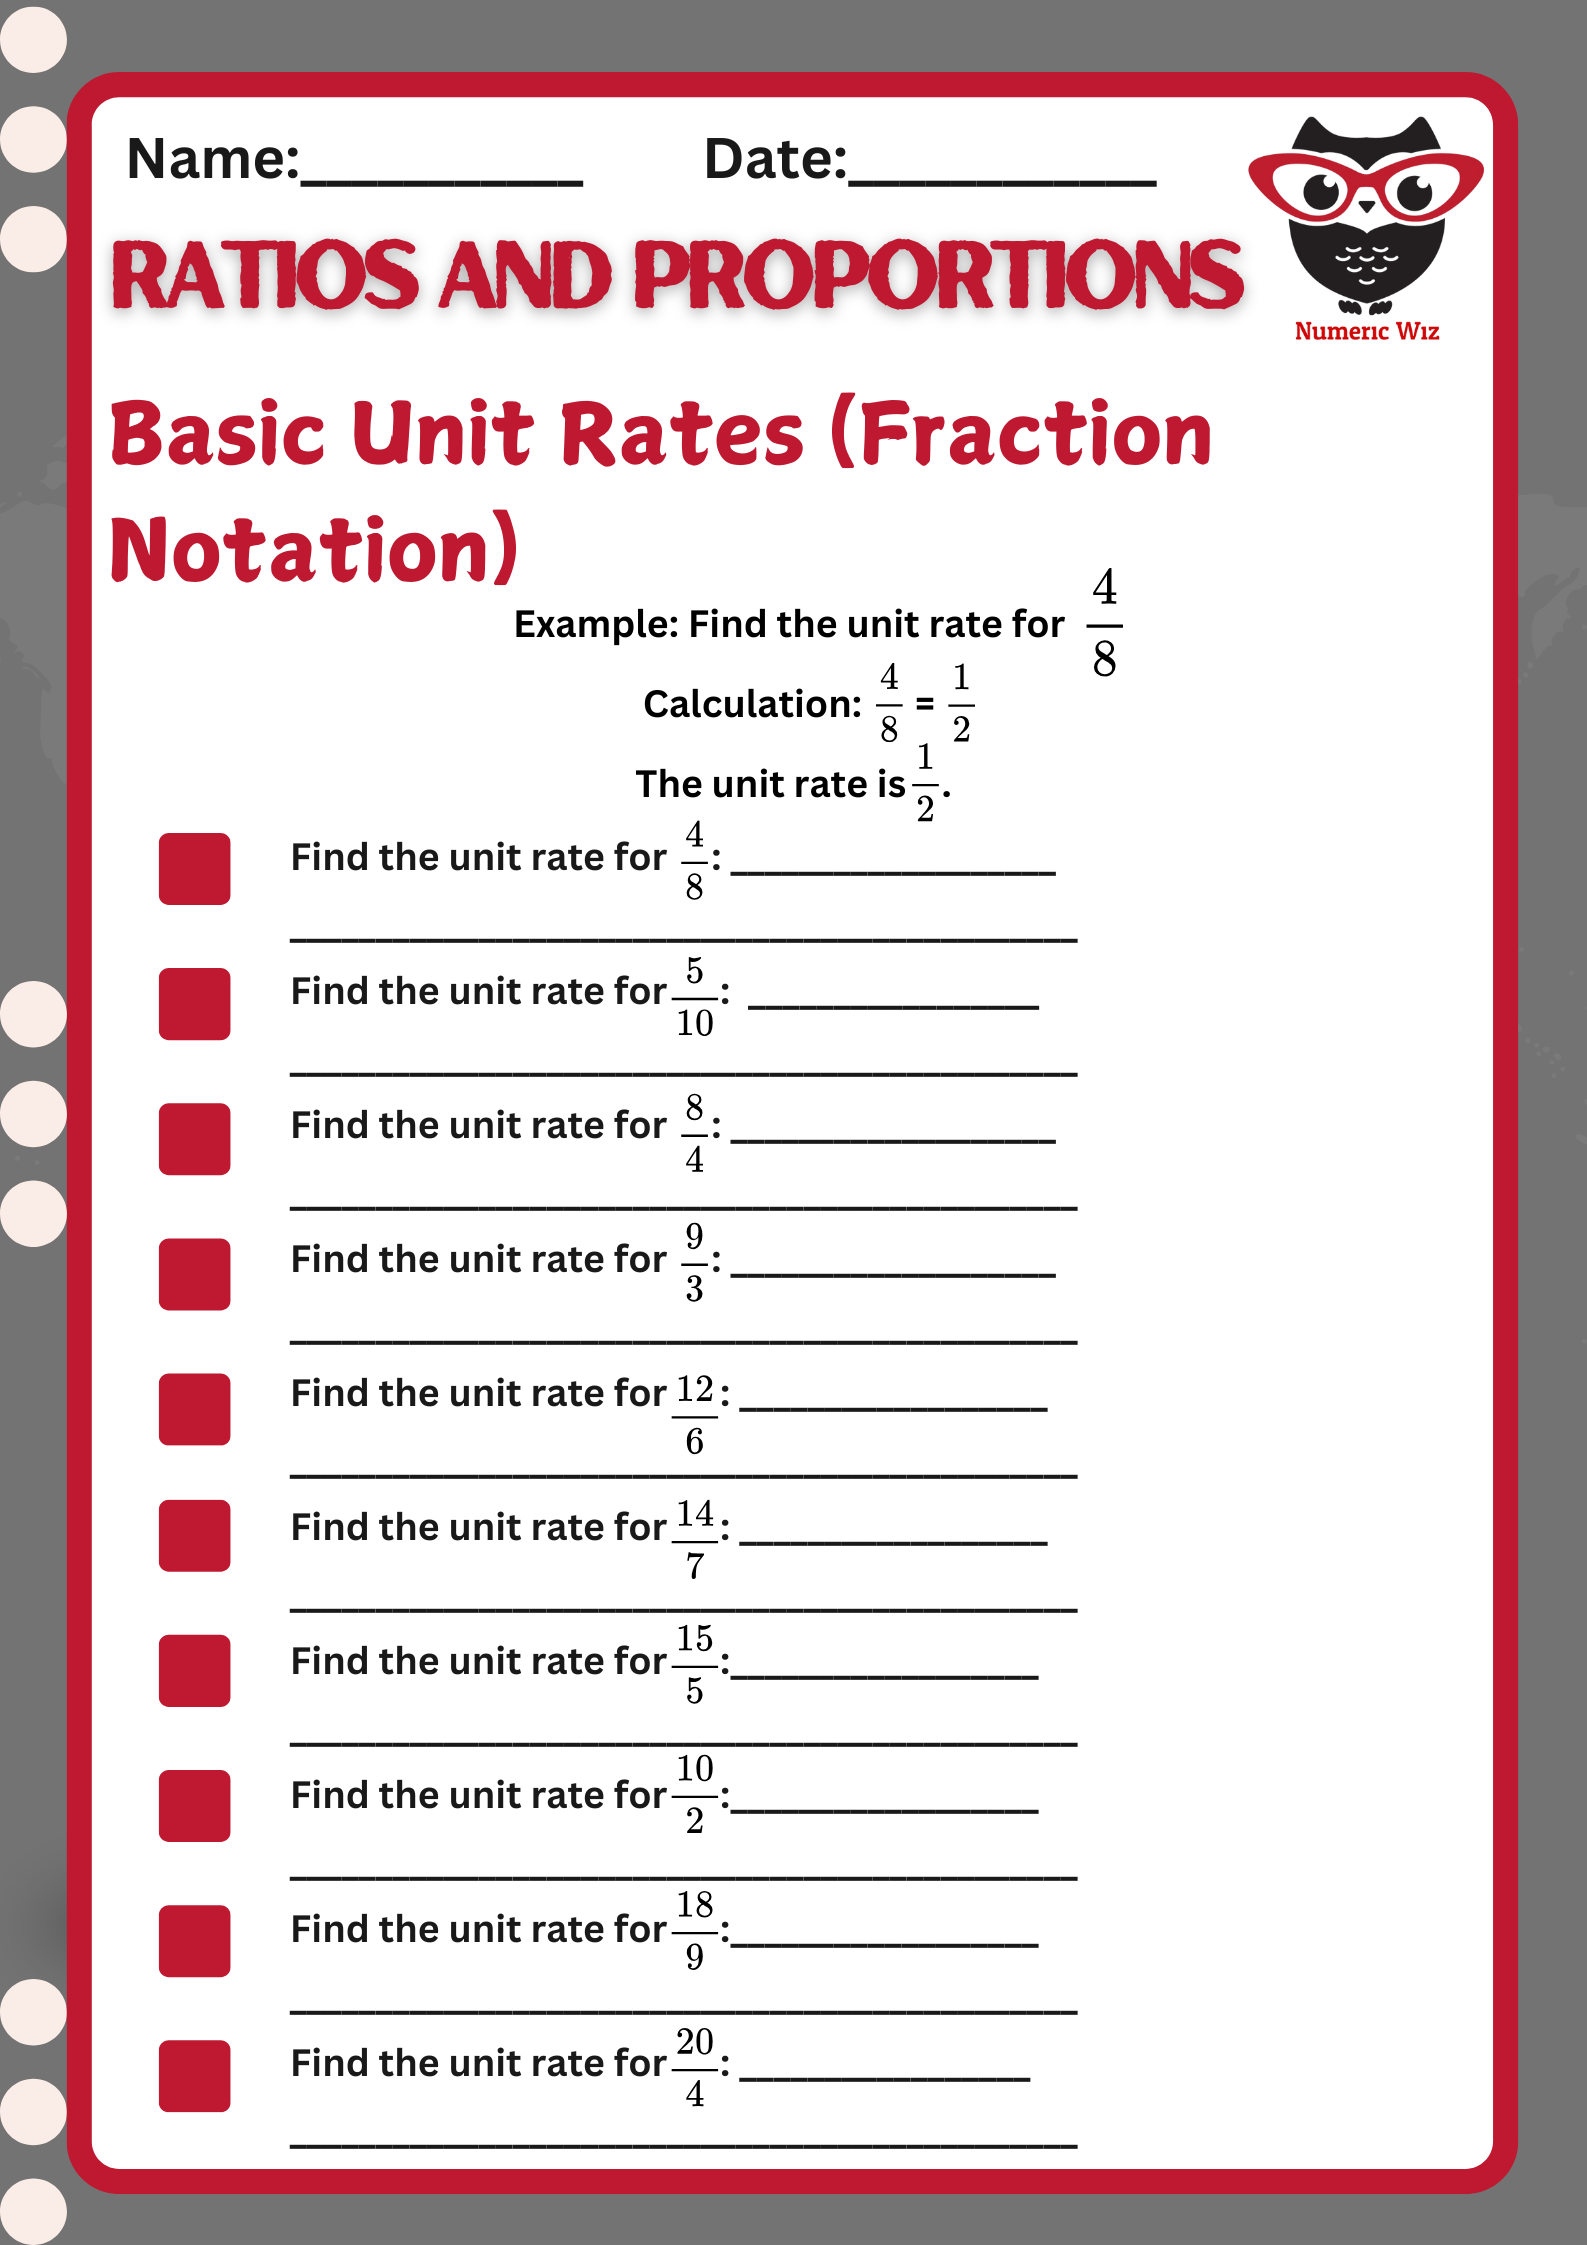
The constant k is the same as the unit rate.
If you multiply x by k, you’ll always get y in a proportional relationship.
This is how many real-world problems — like price per item or speed — are solved using math!
 Great For:
Grade 7 ratio & proportion units
Visual learners who enjoy graphs
Strengthening skills before algebra
Homework, classwork, or math centers
Explore our Extraordinary Worksheets, Dive in and start solving today!