Identify Proportional Relationships from Tables
 Identify Proportional Relationships from Tables
Identify the constant of proportionality (unit rate) in tables, graphs, equations, diagrams, and verbal descriptions of proportional relationships.
  • Analyze tables of paired values.
  • Identify proportional relationships using consistent ratios.
  • Understand and explain the concept of the constant of proportionality (k).
  • Strengthen foundational skills needed for graphing and equations.

Download  Identify Proportional Relationships from Tables

Click the button below to get instant access to these premium worksheets for use in the classroom or at a home.

7g17

Grade Level: 6–7 | Topic: Ratios & Proportions

Skill Focus: Analyzing Tables for Proportionality

 What This Worksheet Teaches: 

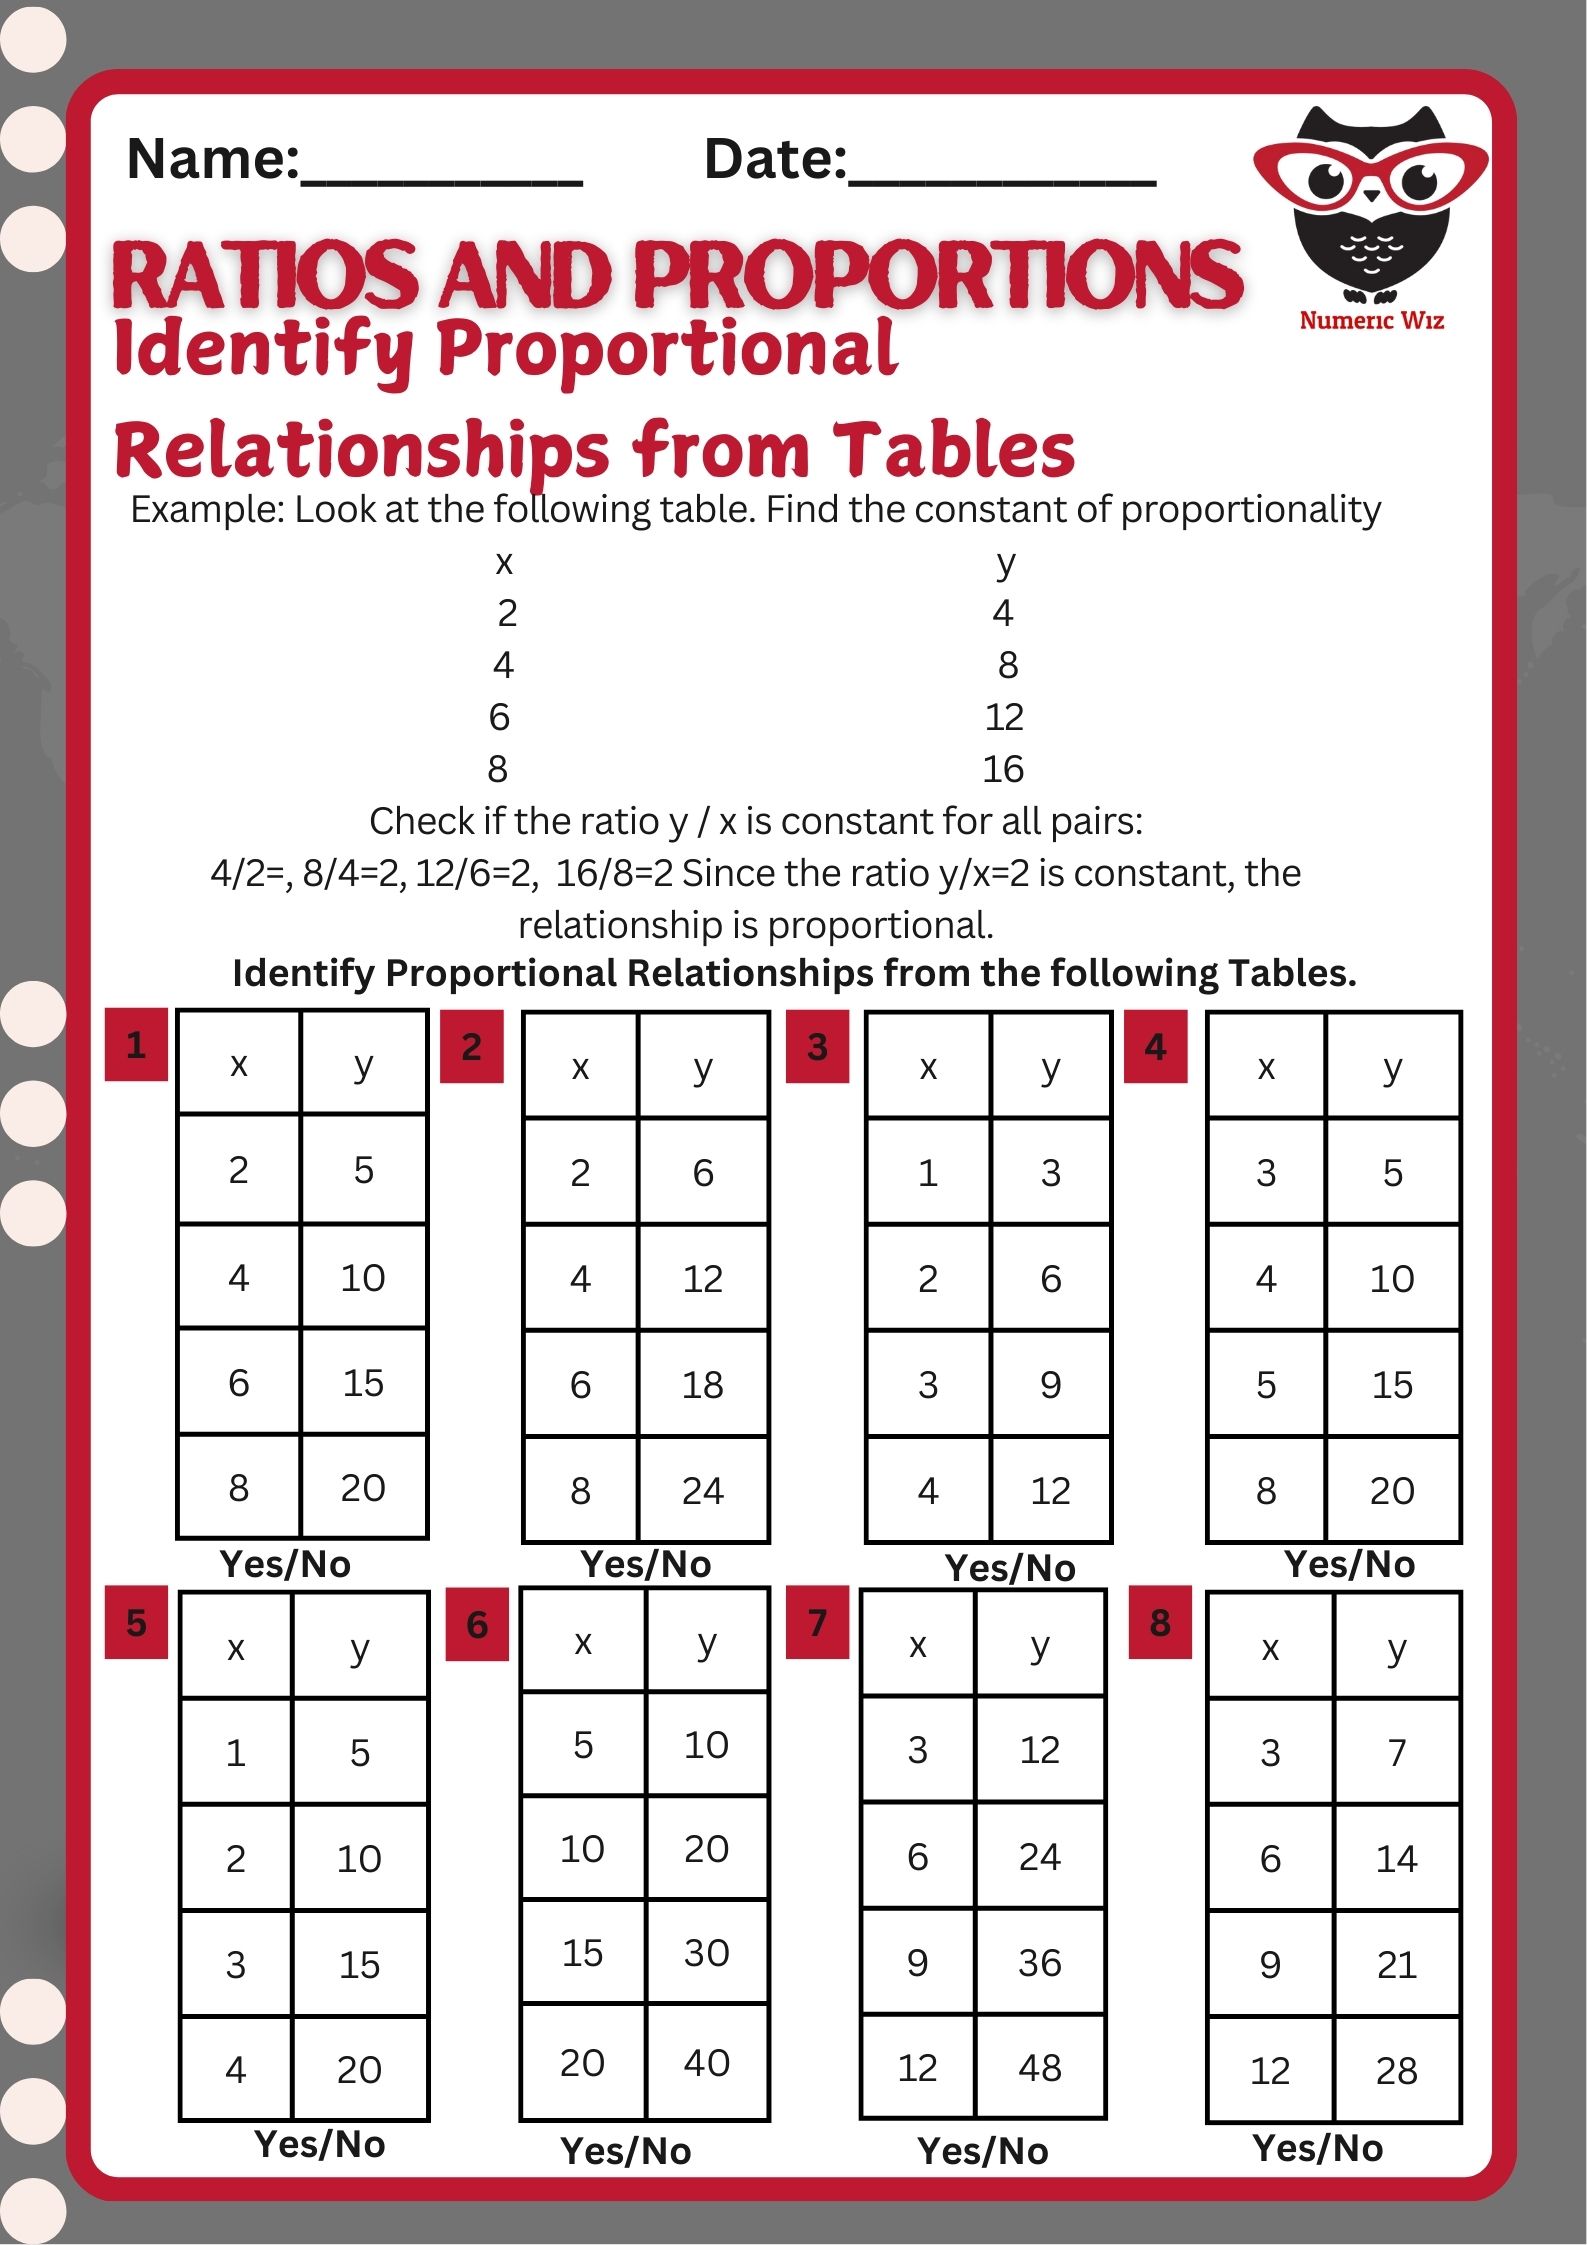
Understanding proportional relationships is essential in middle school math. This worksheet helps students determine whether two quantities in a table are proportional by checking for a constant ratio. If that ratio stays the same across all pairs, the relationship is proportional — simple as that!

 Topic Introduction 

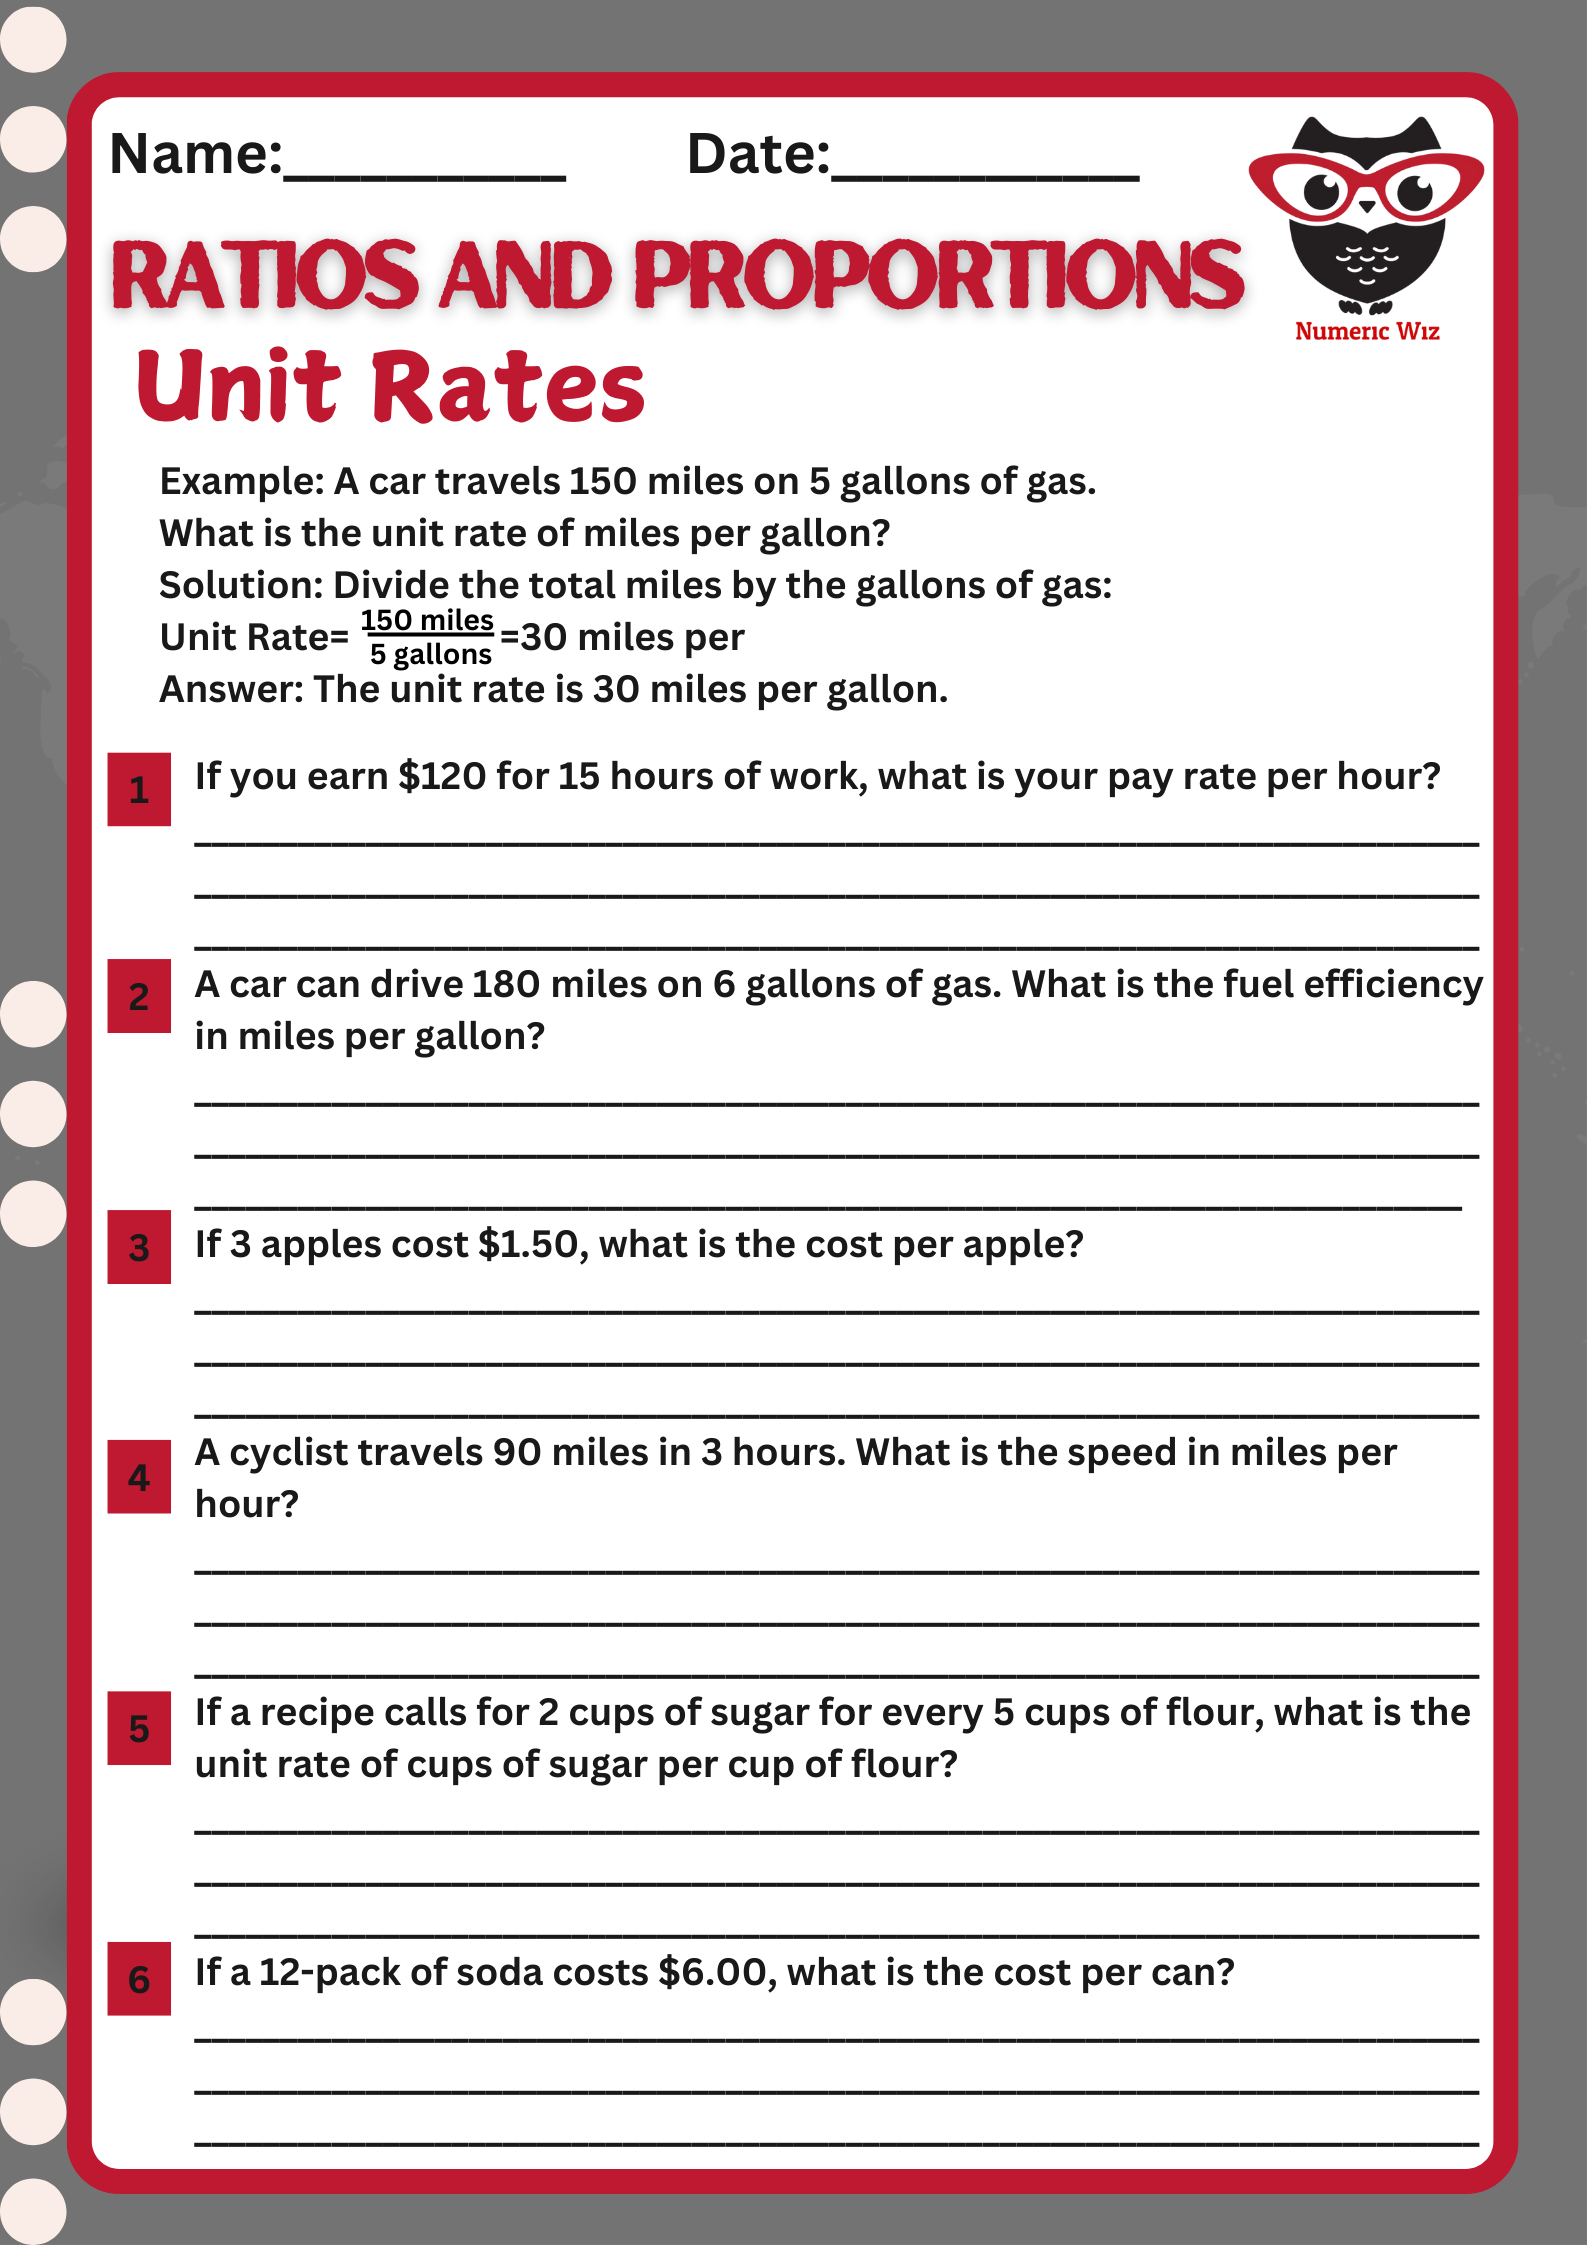
Have you ever doubled a recipe? Or calculated how much money you’d make if you earned $10 per hour? Both are examples of proportional relationships. In math, when two quantities increase or decrease at the same rate, we say they’re proportional.

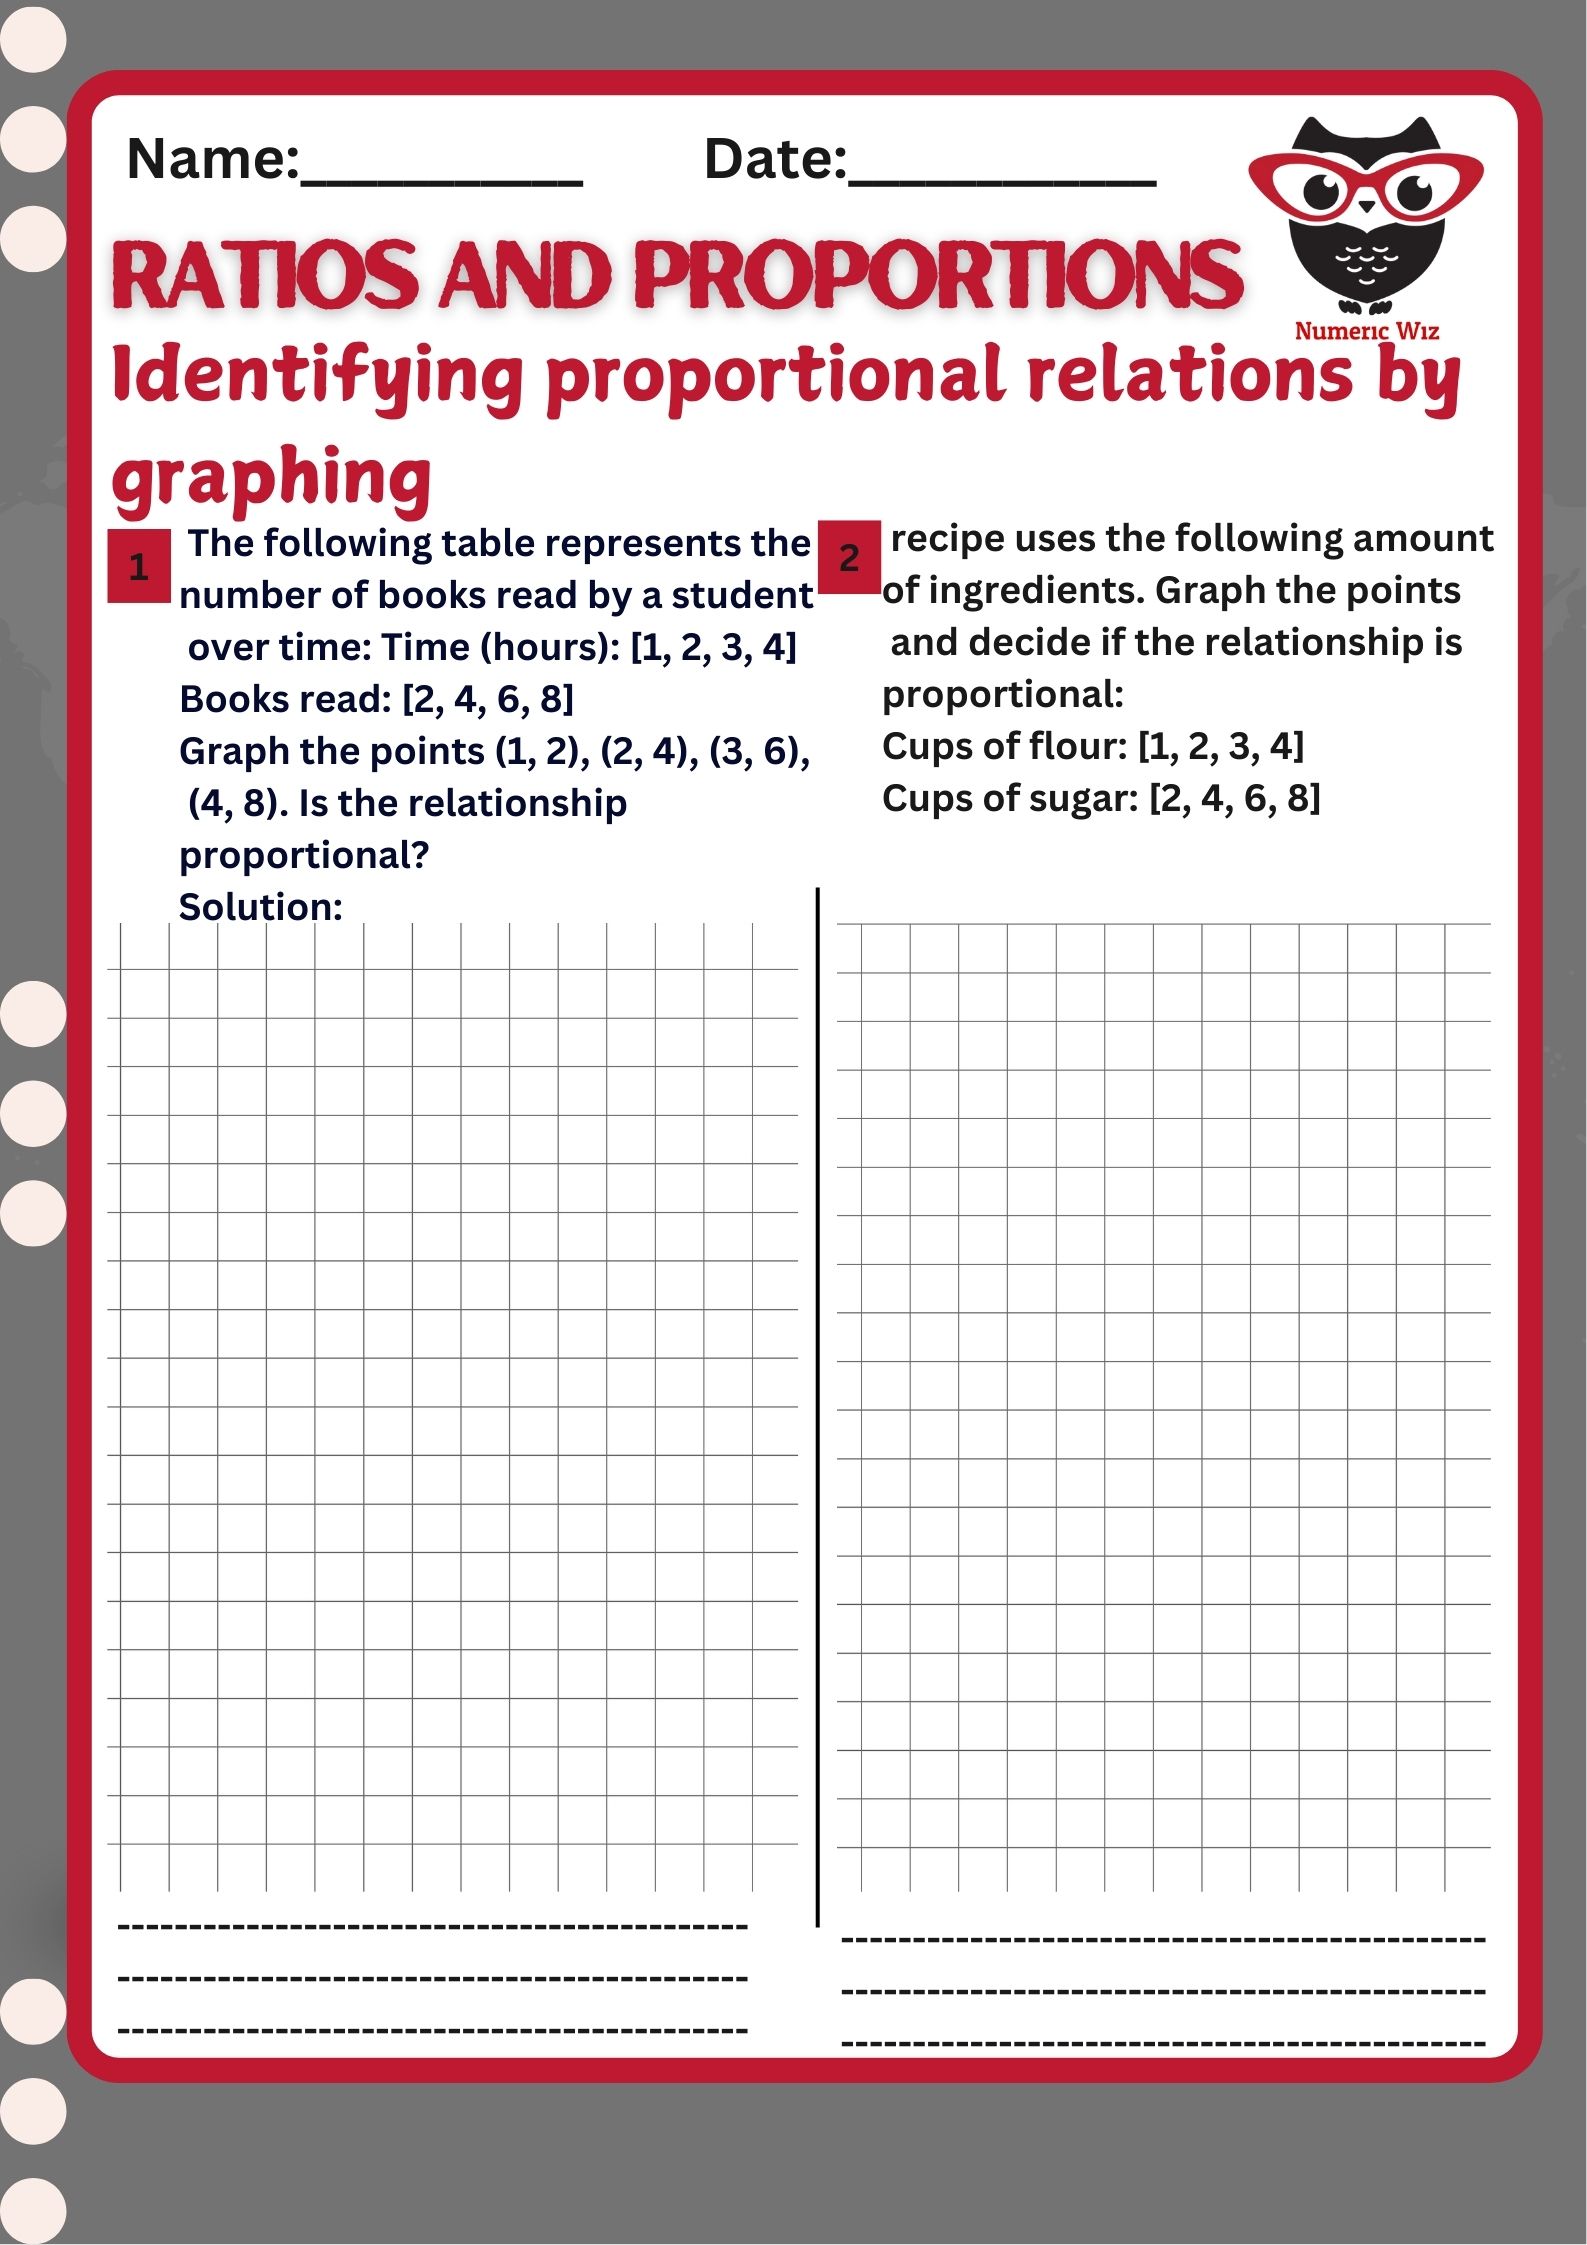
This worksheet is your chance to become a “Proportion Detective!” You’ll look at each table and decide:
 Does the y-value always increase at the same rate as x?

 Is the ratio y ÷ x (or x:y) the same every time?

 Solved Example 

Table:

x y
2 4
4 8
6 12
8 16
  1. Find the ratio y ÷ x for each row:

    • 4 ÷ 2 = 2

    • 8 ÷ 4 = 2

    • 12 ÷ 6 = 2

    • 16 ÷ 8 = 2

  2. The ratio is the same (constant) each time: k = 2

Yes, the relationship is proportional.
This means y = 2x, a classic proportional equation!

  • Analyze tables of paired values.

  • Identify proportional relationships using consistent ratios.

  • Understand and explain the concept of the constant of proportionality (k).

  • Strengthen foundational skills needed for graphing and equations.

Real-Life Connection:

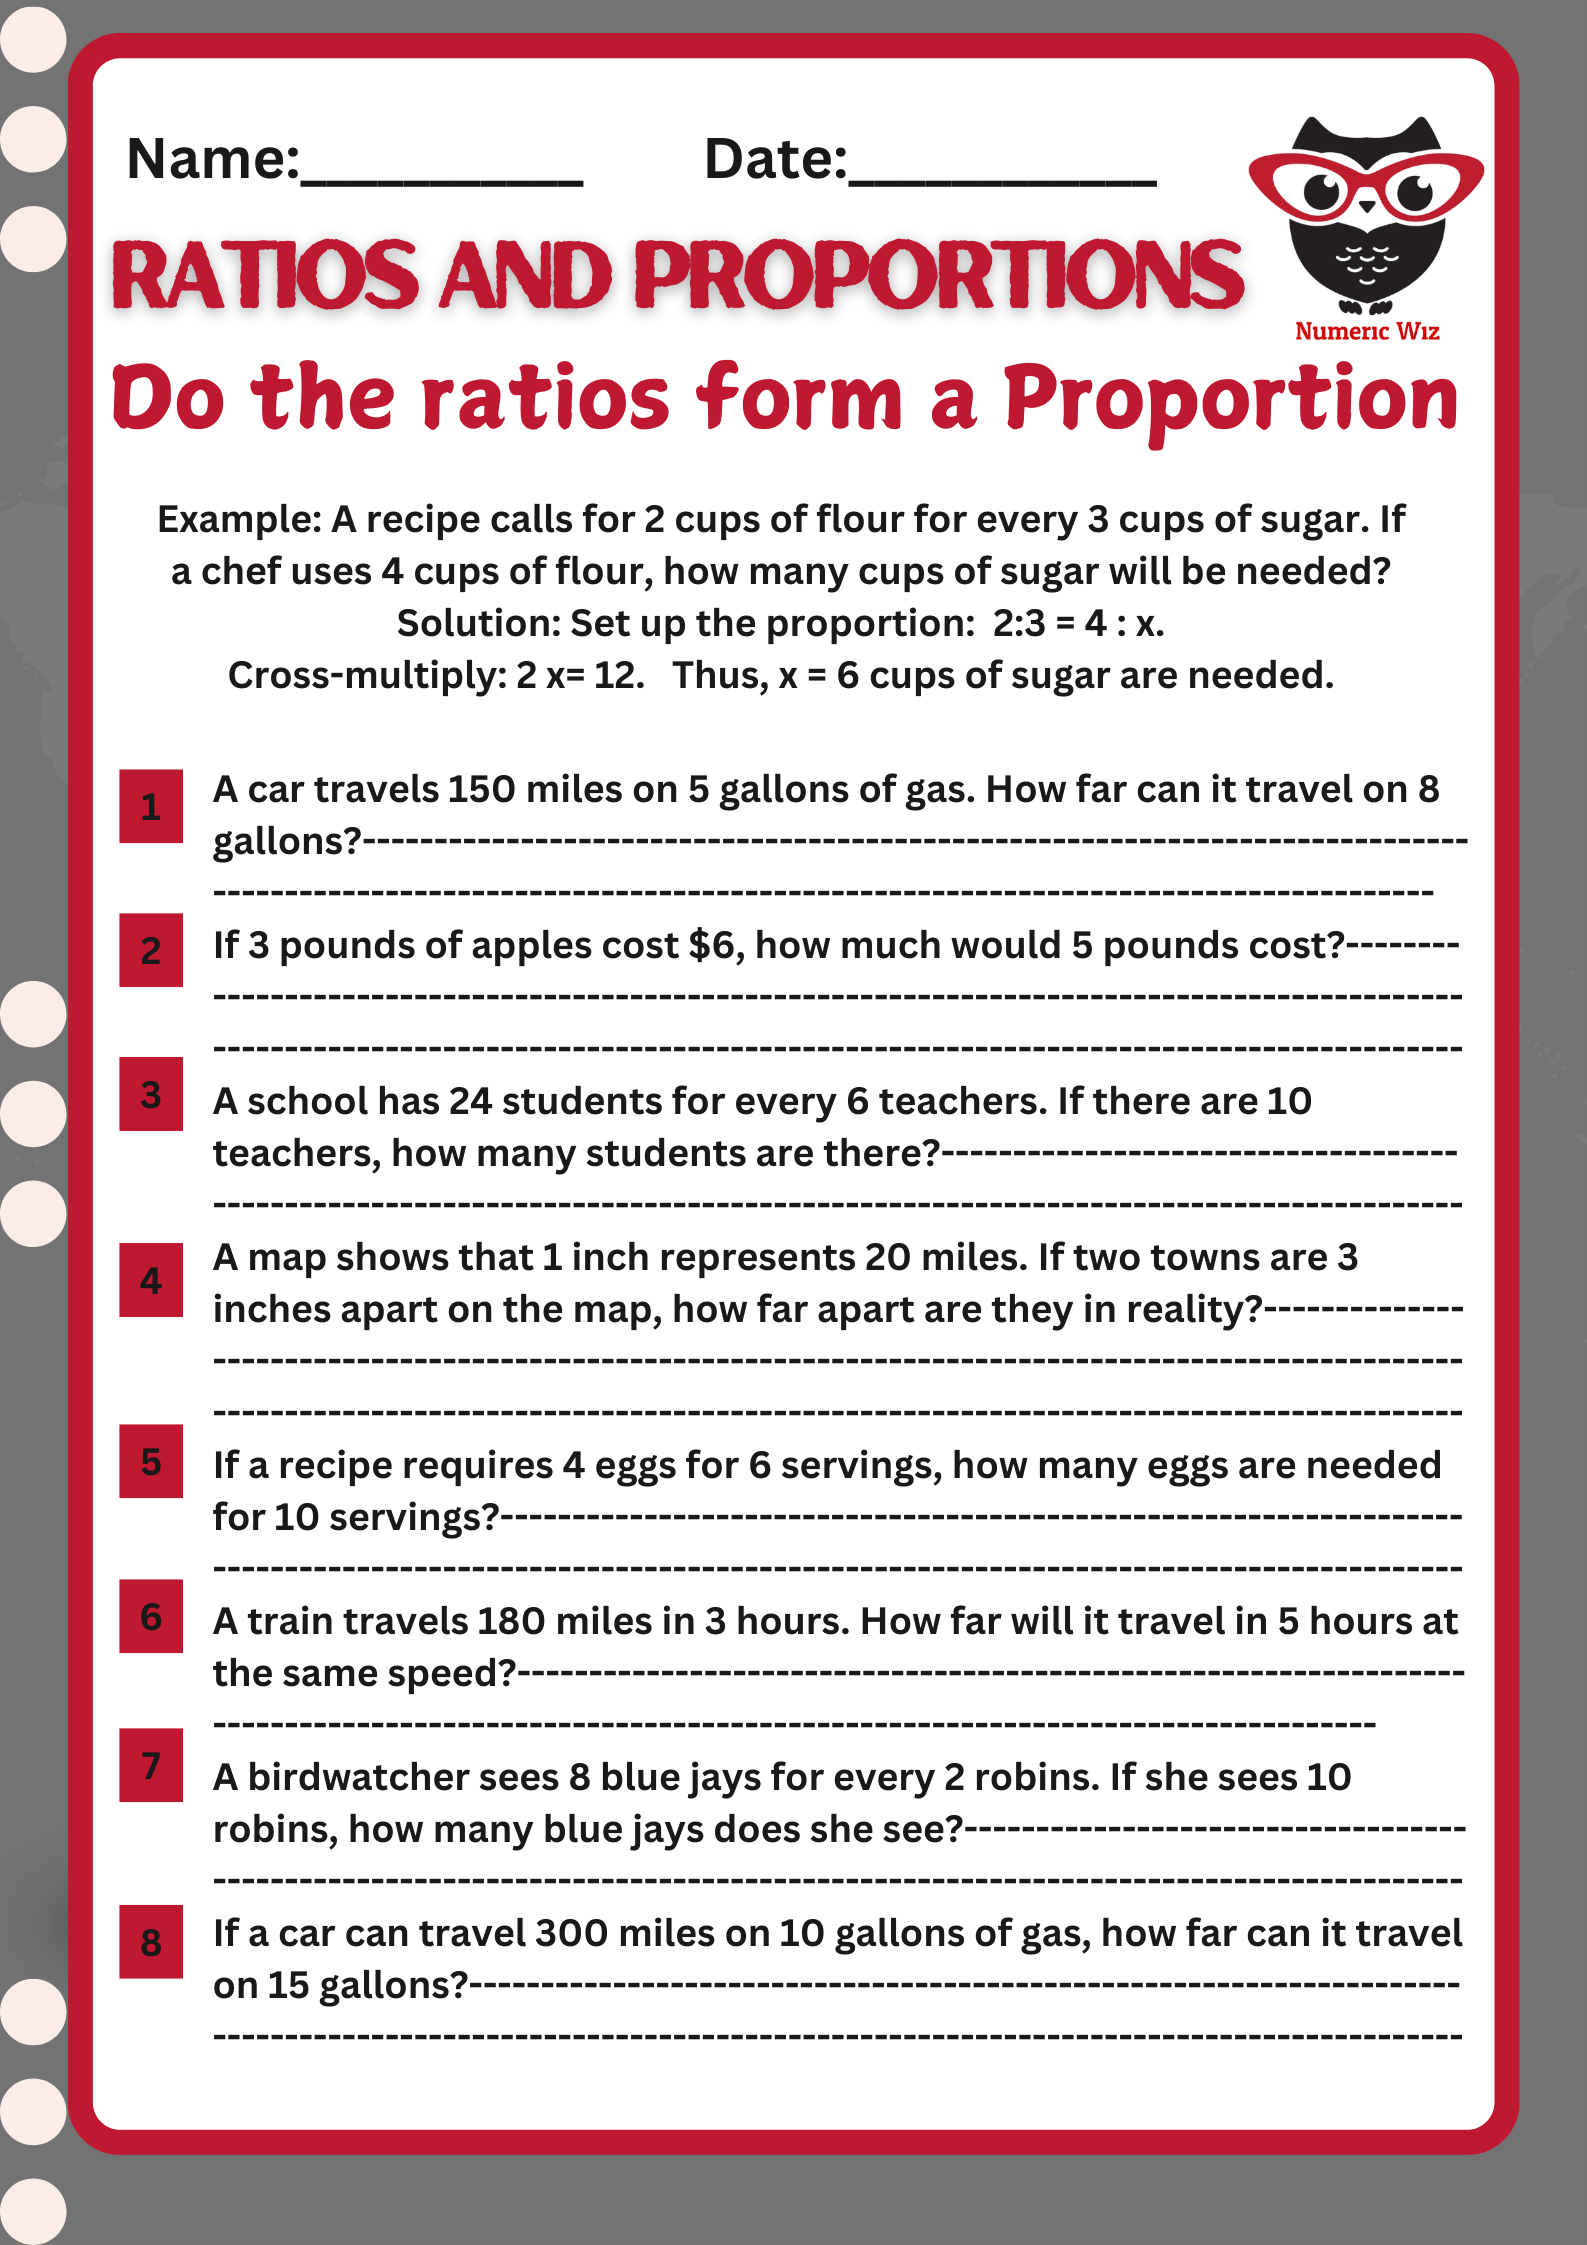
Imagine you’re buying apples — $3 for 1 pound. If you buy 2 pounds, it costs $6. Buy 3 pounds?

That’s $9.

The cost is directly proportional to the weight — and you’re using math from this very worksheet in the real world!

This worksheet is ideal for reinforcing graphing skills and deepening student's understanding of ratios, equations, and proportionality  all while connecting algebra to real-world situations.

Premium Membership

whats inside Premium package

$0/per month

For a limited time

All Answer Keys
An Ad-free Experience
Premium/Full Screen PDFs
Unlimited Access

More Similar Worksheets

7g14
Identifying Proportional Relationships by Graphing
3g7
Unit Rates with Ratios of Quantities
7g11
Ratios and Proportions: Writing Equations for Proportional Relationships from Graphs
2g7
Unit Rates with Ratios of Areas
To download this worksheet collection, select the bellow option either to Login or Register (it only takes a minute) and you’ll be brought right back to this page to start the download!
  • Sign Up
Lost your password? Please enter your username or email address. You will receive a link to create a new password via email.