Have you ever noticed how the cost of groceries increases in direct proportion to the number of items you buy? Or how the more hours you work, the more money you earn at a fixed hourly rate? These are examples of proportional relationships—when two quantities increase or decrease at a constant rate.
We have two powerful tools:
Equations – Looking at the mathematical rule behind the relationship.
Graphs – Checking if the plotted points form a straight line through the origin.
A relationship is proportional if it follows this equation: y=kx
where k is the constant of proportionality (the fixed multiplier between the two quantities).
The equation is in the form y = kx.
There is no extra number added or subtracted (like +5 or -3).
If x = 0, then y = 0 (it passes through the origin).
A bakery sells cupcakes in packs. The total price (y) is determined by the number of packs (x). The equation is: y=3x
Is this relationship proportional?
Solution:
The equation is in the form y = kx (where k = 3).
There’s no extra number added or subtracted.
The cost per pack stays constant at $3 per pack.
Yes! This is a proportional relationship. 🎉
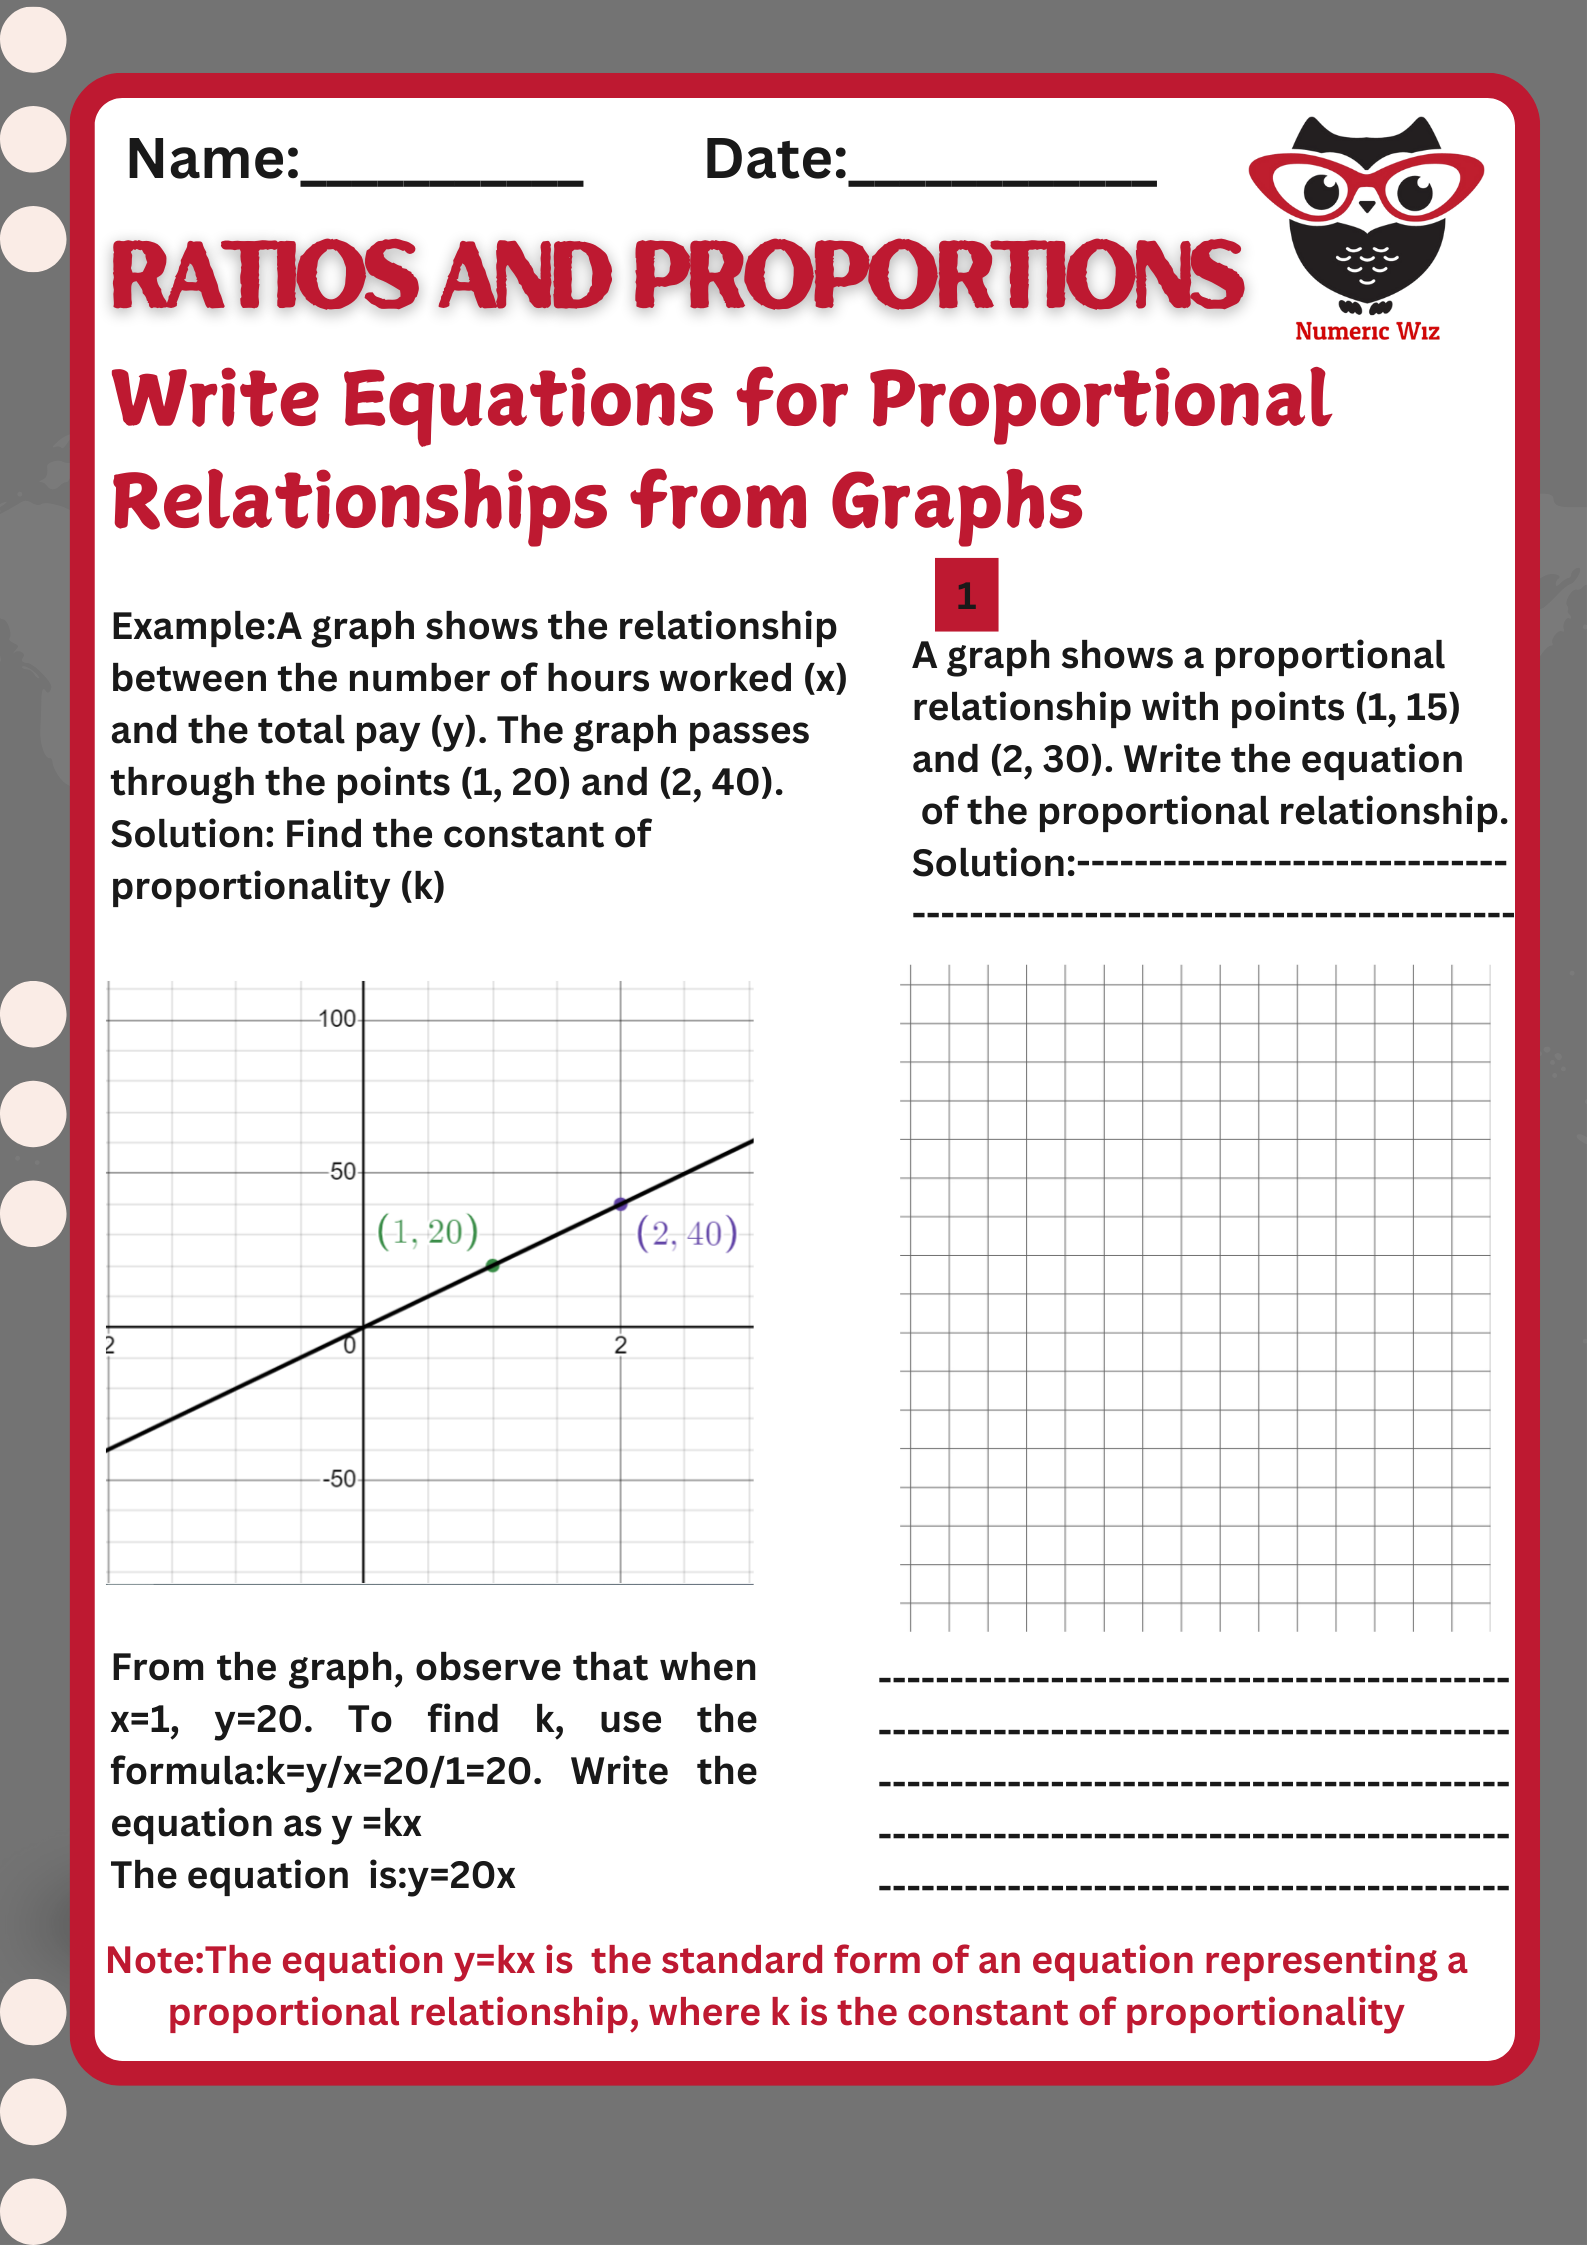
A graph shows a proportional relationship when:
The points form a straight line.
The line passes through the origin (0,0).
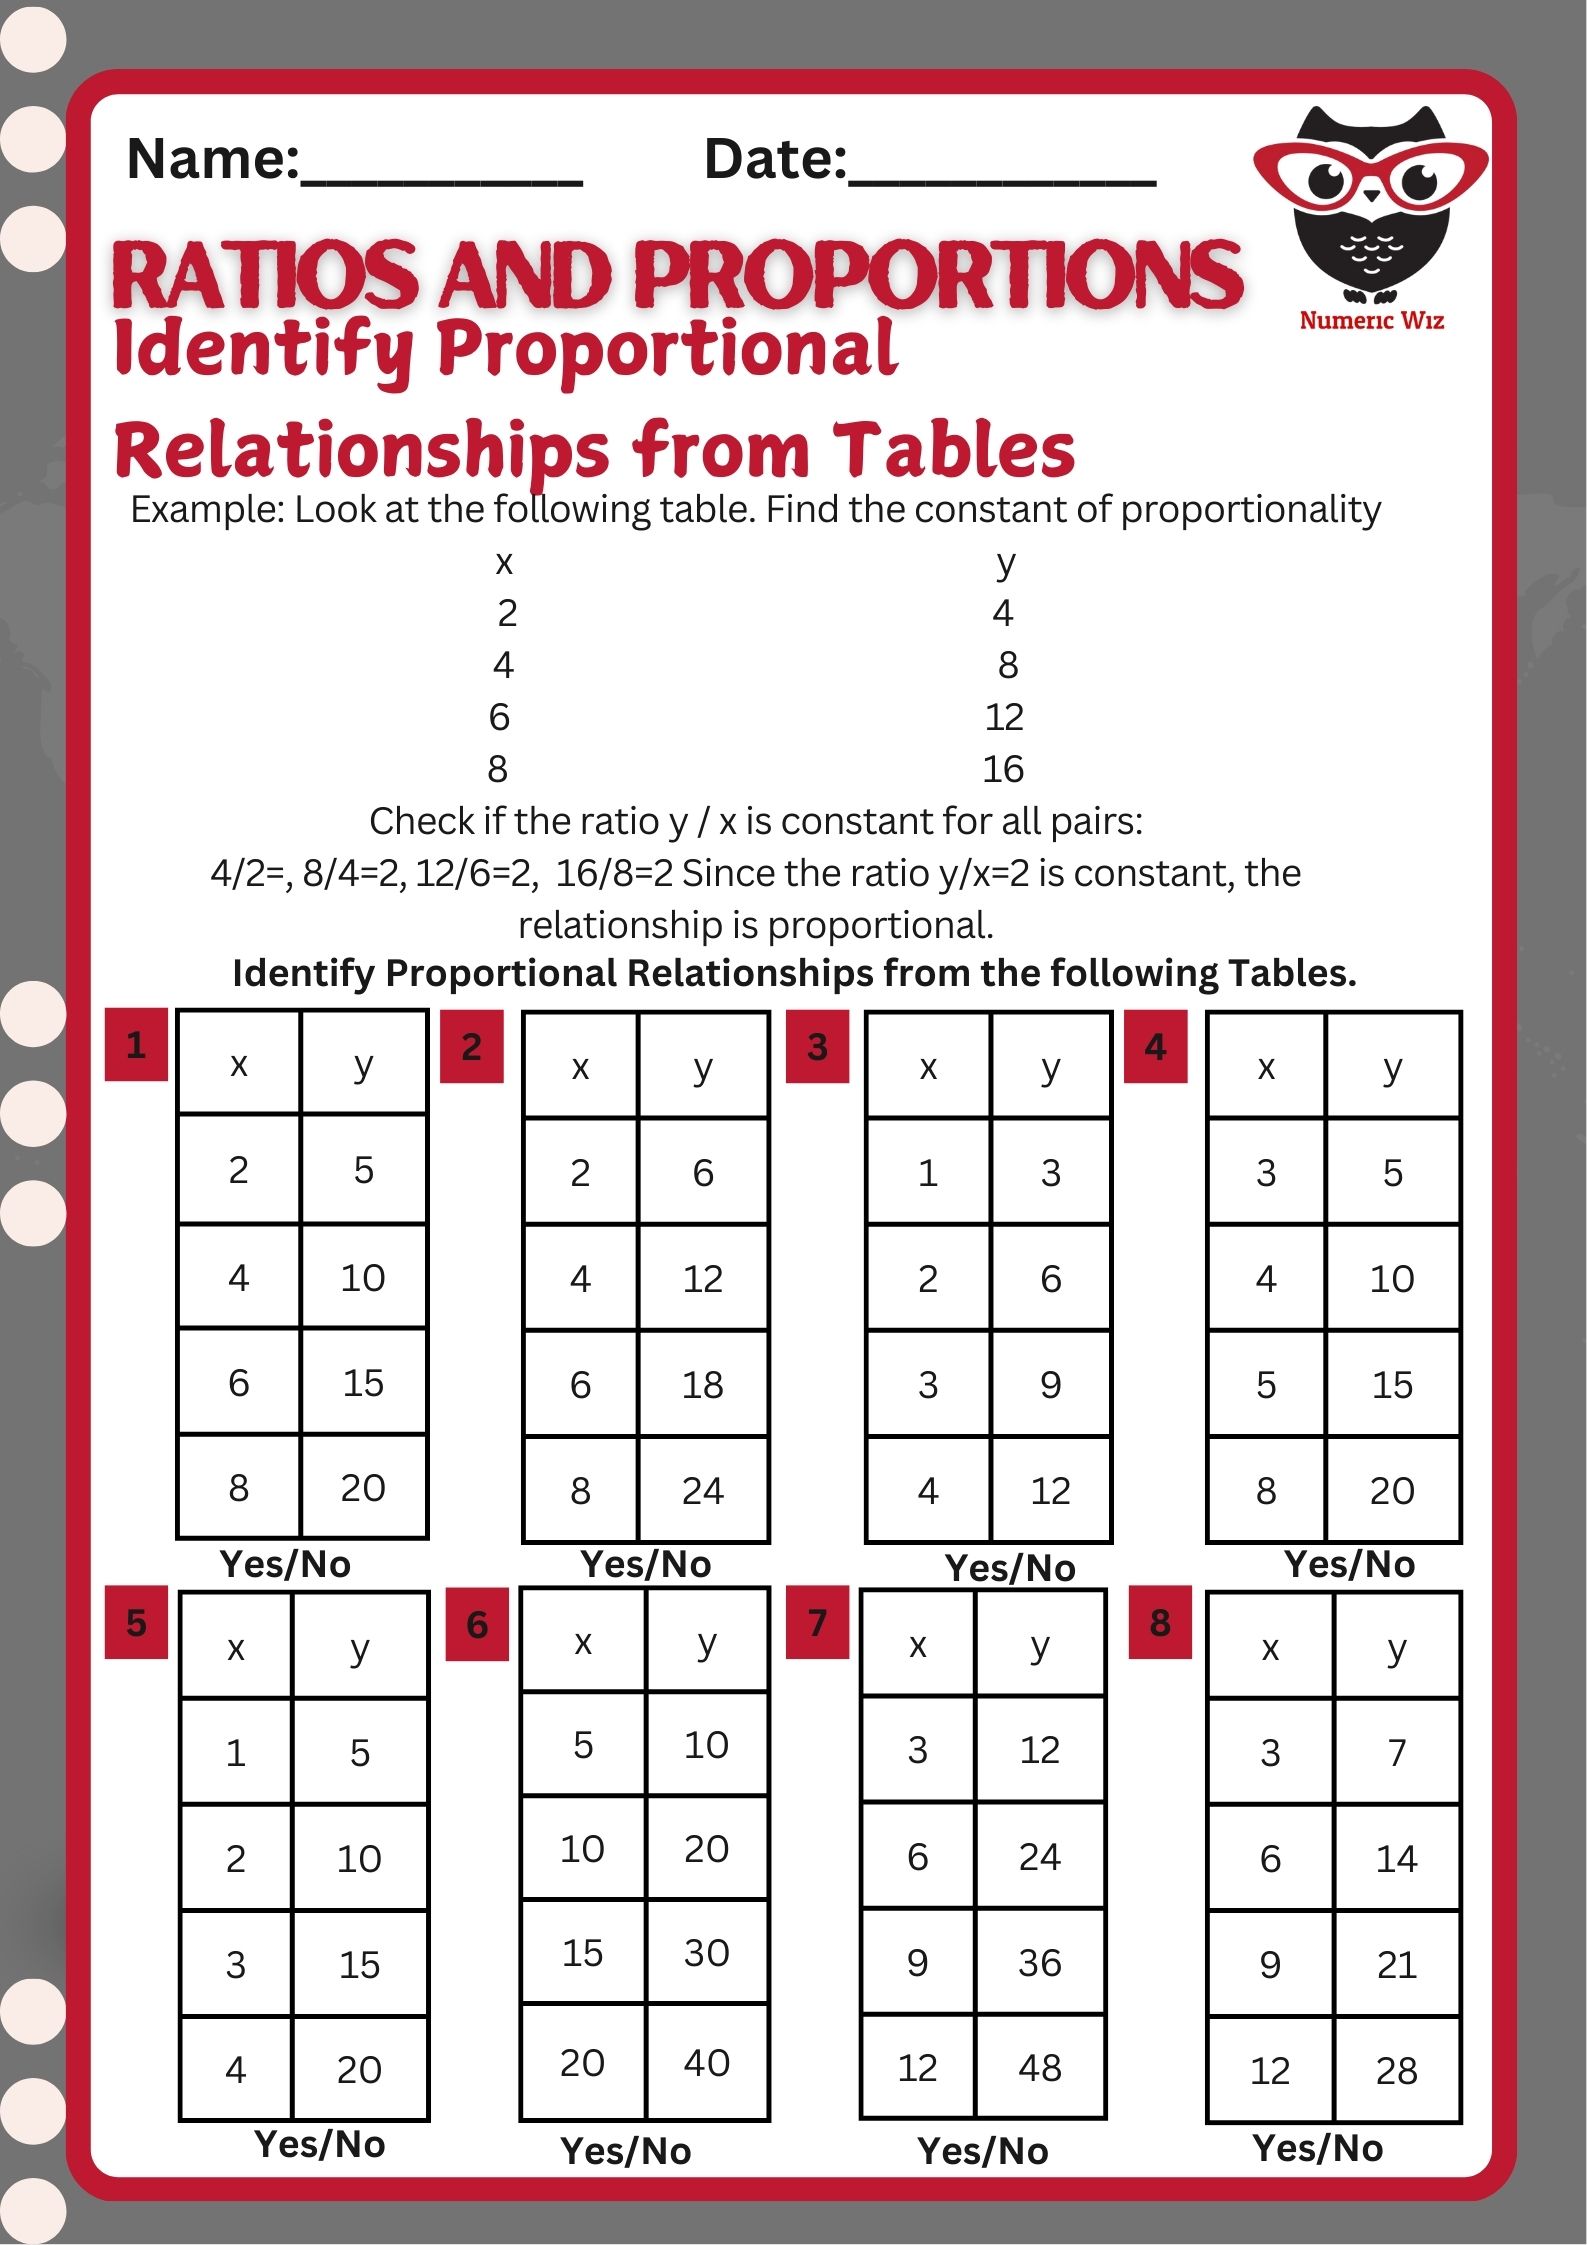
Emily rents bikes at a park. The table below shows her total cost for different hours of rental.
| Hours (x) | Total Cost ($y$) |
|---|---|
| 1 | 8 |
| 2 | 16 |
| 3 | 24 |
| 4 | 32 |
Is this relationship proportional?
Plot the points: (1,8), (2,16), (3,24), (4,32).
The graph forms a straight line through (0,0).
Yes! This is a proportional relationship.
Here’s the graph: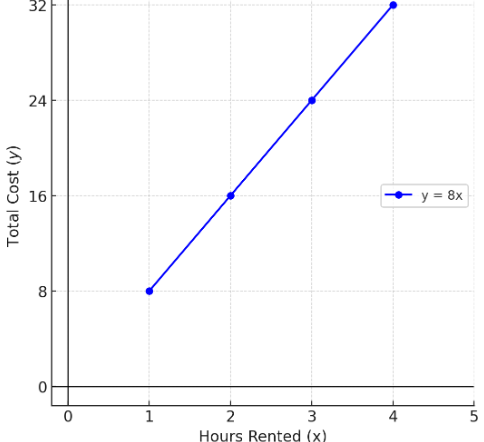
Speed & Time: If you travel at a steady speed of 60 miles per hour, the distance traveled is proportional to the time spent driving.
Shopping: If each apple costs $2, then the total cost is proportional to the number of apples you buy.
Cooking: Doubling a recipe keeps ingredient ratios the same.
Keep practicing, and soon you'll be a pro at identifying proportional relationships!