Grade Level: 7th Grade | Math Topic: Ratios & Proportions
Subtopic: Graphing Proportional Relationships
Skill Focus: Visualizing proportionality using coordinate graphs
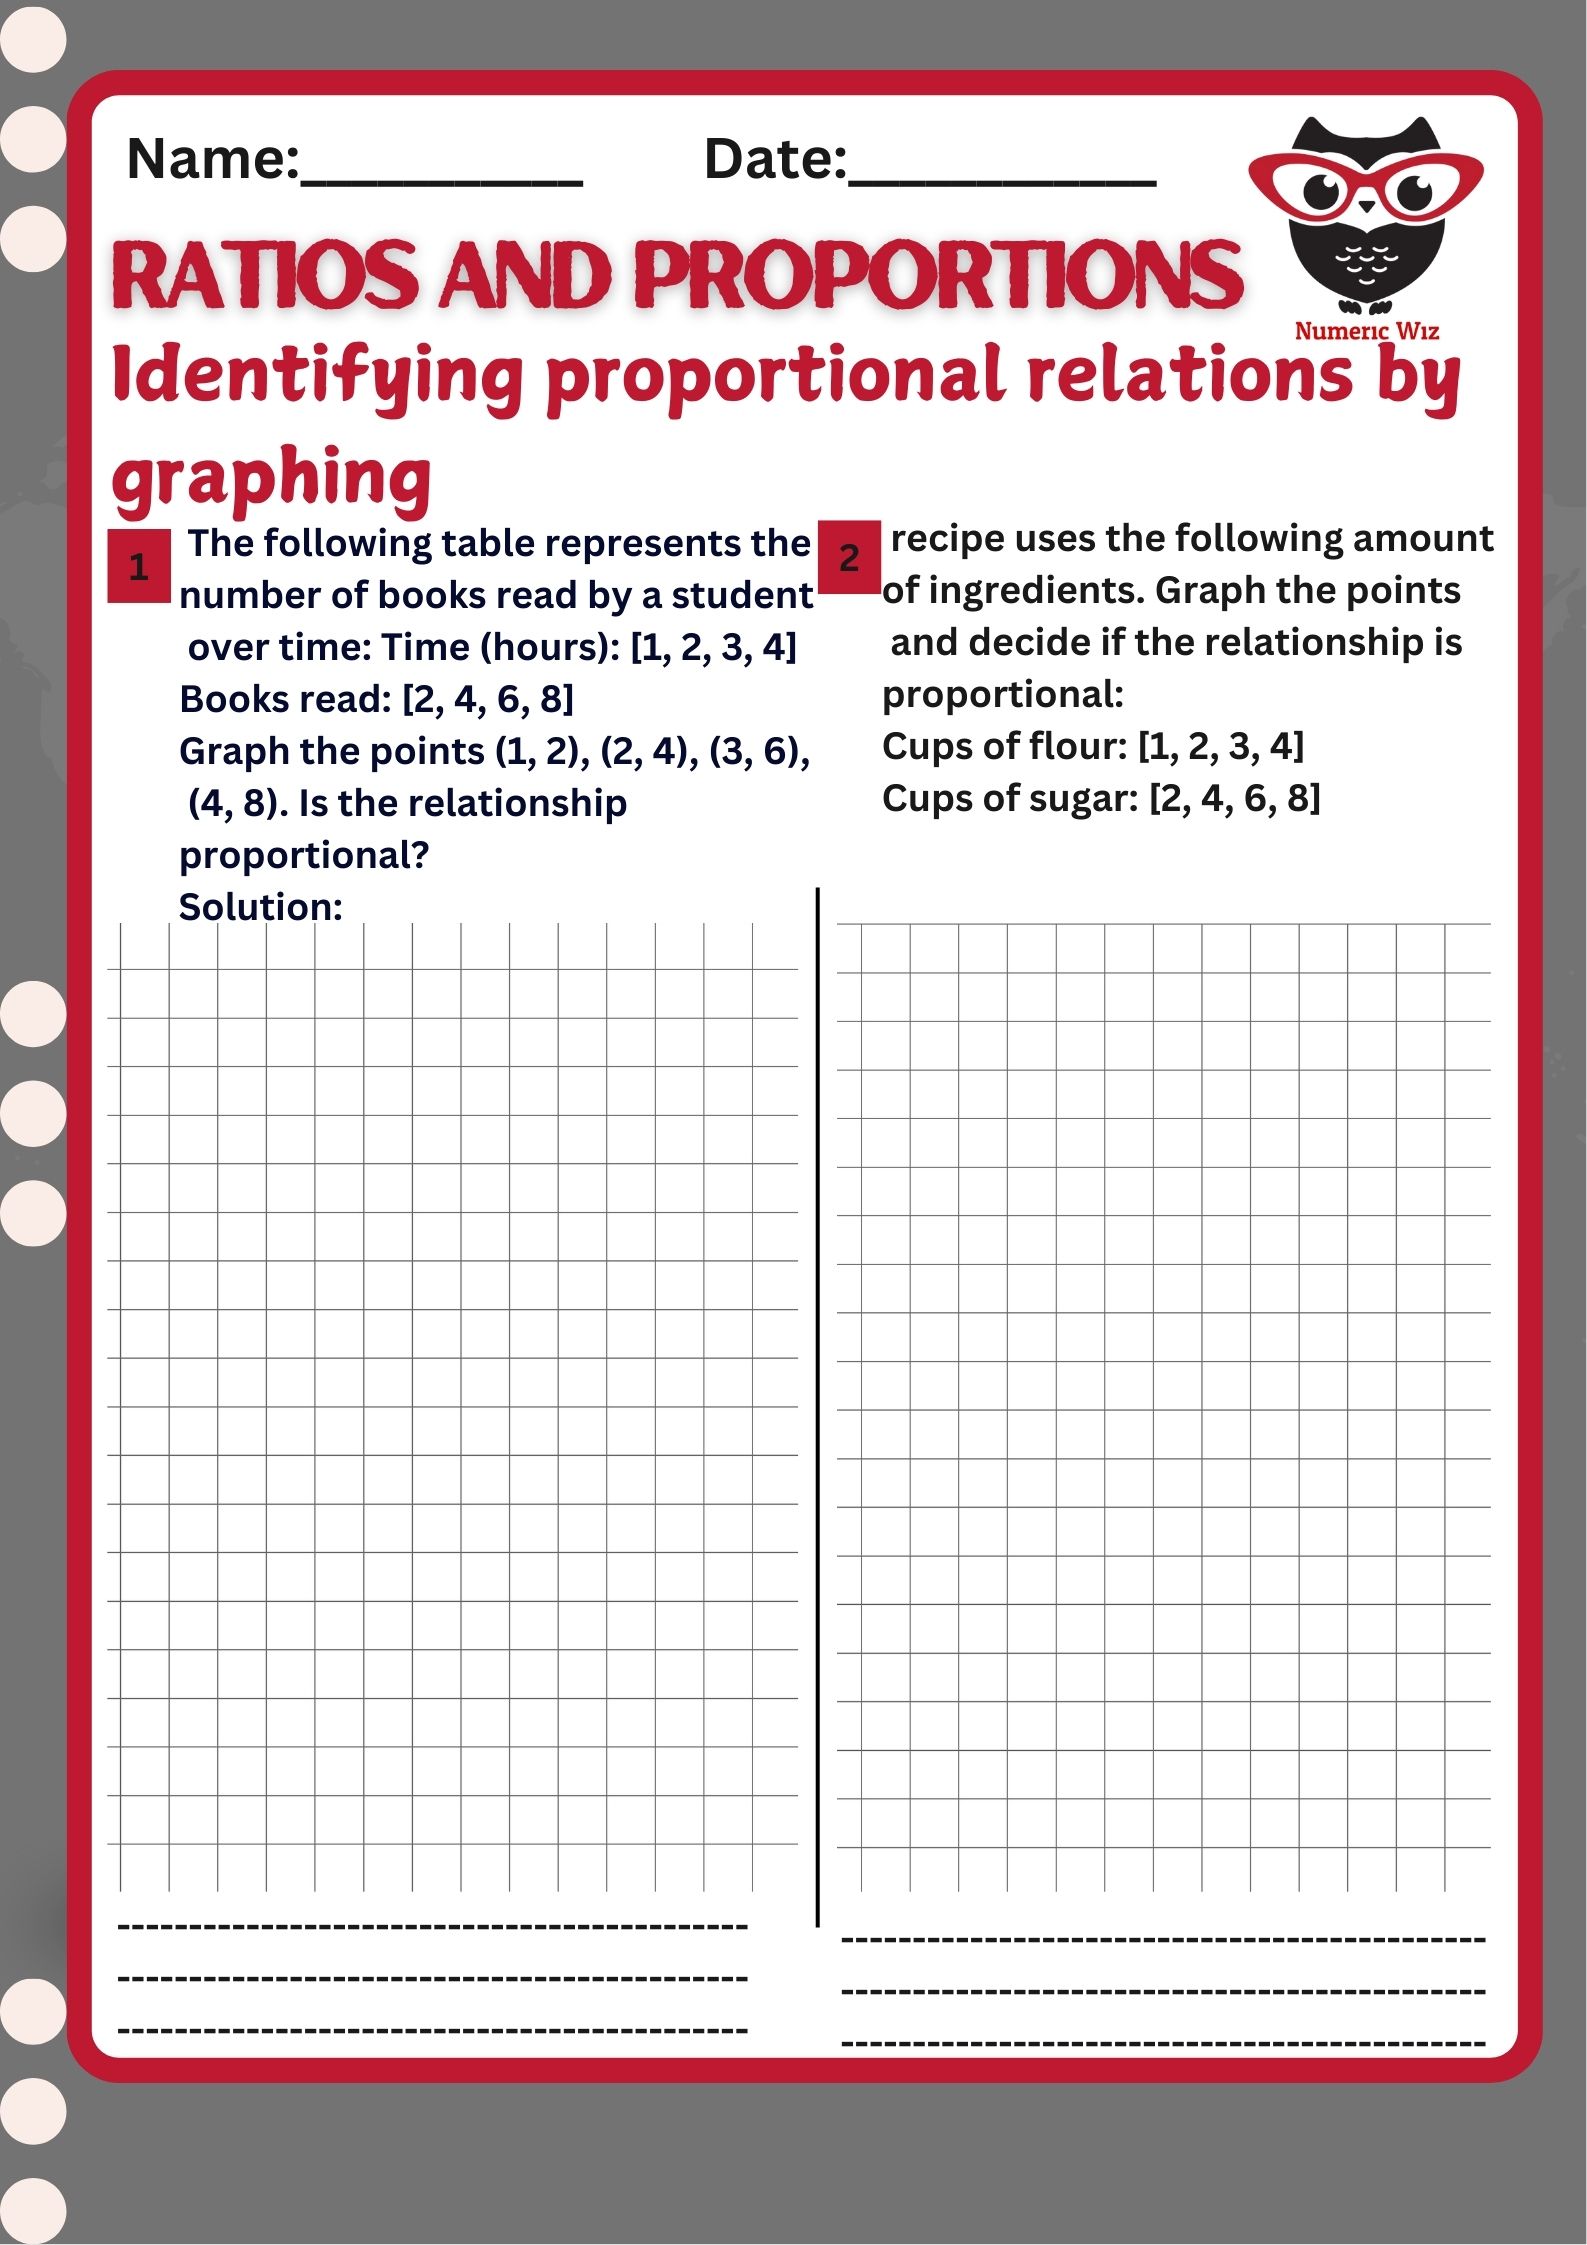
This engaging and interactive worksheet helps students learn how to identify proportional relationships using graphs. Students are given real-world tables (like books read over time or ingredients in a recipe) and asked to plot the points on a graph to determine whether the relationship is proportional.
Proportional relationships are everywhere — in recipes, shopping, reading schedules, and even video games! When two values increase at a constant rate, they form a straight line on a graph that passes through the origin (0, 0). That’s what this sheet helps learners recognize.
 Solved Example (From Worksheet):
Time (hours): [1, 2, 3, 4]
Books read: [2, 4, 6, 8]
Step 1: Plot the Points
(1, 2), (2, 4), (3, 6), (4, 8)
Step 2: Analyze the Graph
Draw a straight line through these points.
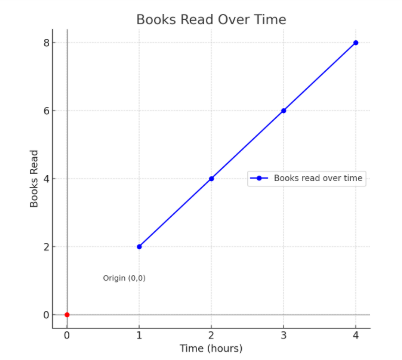
The line goes through the origin (0, 0) and the other points lie perfectly on it.
Graph:
(Graph would show a straight line passing through the points and (0,0))
Conclusion:
Yes, this is a proportional relationship. The values increase at a constant rate, and the graph is a straight line through the origin.
Solution:
Yes, the relationship is proportional. The constant of proportionality (k) is 2, since for every 1 hour, the student reads 2 books.

If it’s straight, it’s proportional!
A straight line graph going through (0, 0) means the two things are growing in perfect sync.
Baking is basically math!
Doubling or halving ingredients in a recipe is a perfect example of proportional thinking in real life.
Proportions help rockets launch!
Engineers use proportional reasoning to scale up models and create real-life rockets!
Explore our Extraordinary Worksheets, Dive in and start solving today!