Identifying Proportional Relationships by Graphing (Grade 7)
Decide whether two quantities are in a proportional relationship, e.g., by testing for equivalent ratios in a table or graphing on a coordinate plane and observing whether the graph is a straight line through the origin.
  • Understand what makes a relationship proportional.

  • Identify proportional relationships visually from graphs.

  • Strengthen skills in plotting and interpreting coordinate points.

  • Build a strong foundation for algebra and real-world math problems.

Download Identifying Proportional Relationships by Graphing (Grade 7)

Click the button below to get instant access to these premium worksheets for use in the classroom or at a home.

7g12

Are you ready to discover if a relationship is proportional — just by looking at a graph? This fun and simple worksheet is designed to help students in Grade 7 learn how to identify proportional relationships using graphing skills.

This worksheet is part of the “Ratios and Proportions” series and helps students visually explore math relationships by plotting points on a graph.

What You’ll Learn:

  • How to plot coordinate points on a graph.

  • How to check if a set of points represents a proportional relationship.

  • How to decide if a line goes through the origin (0, 0) — a key sign of proportionality.

  • How to observe if points lie in a straight line (another sign of proportionality).

Solved Example (with Graph!):

Question:
Plot the points: (1, 10), (2, 20), (3, 30).
Is the relationship proportional?

Step-by-Step Solution:

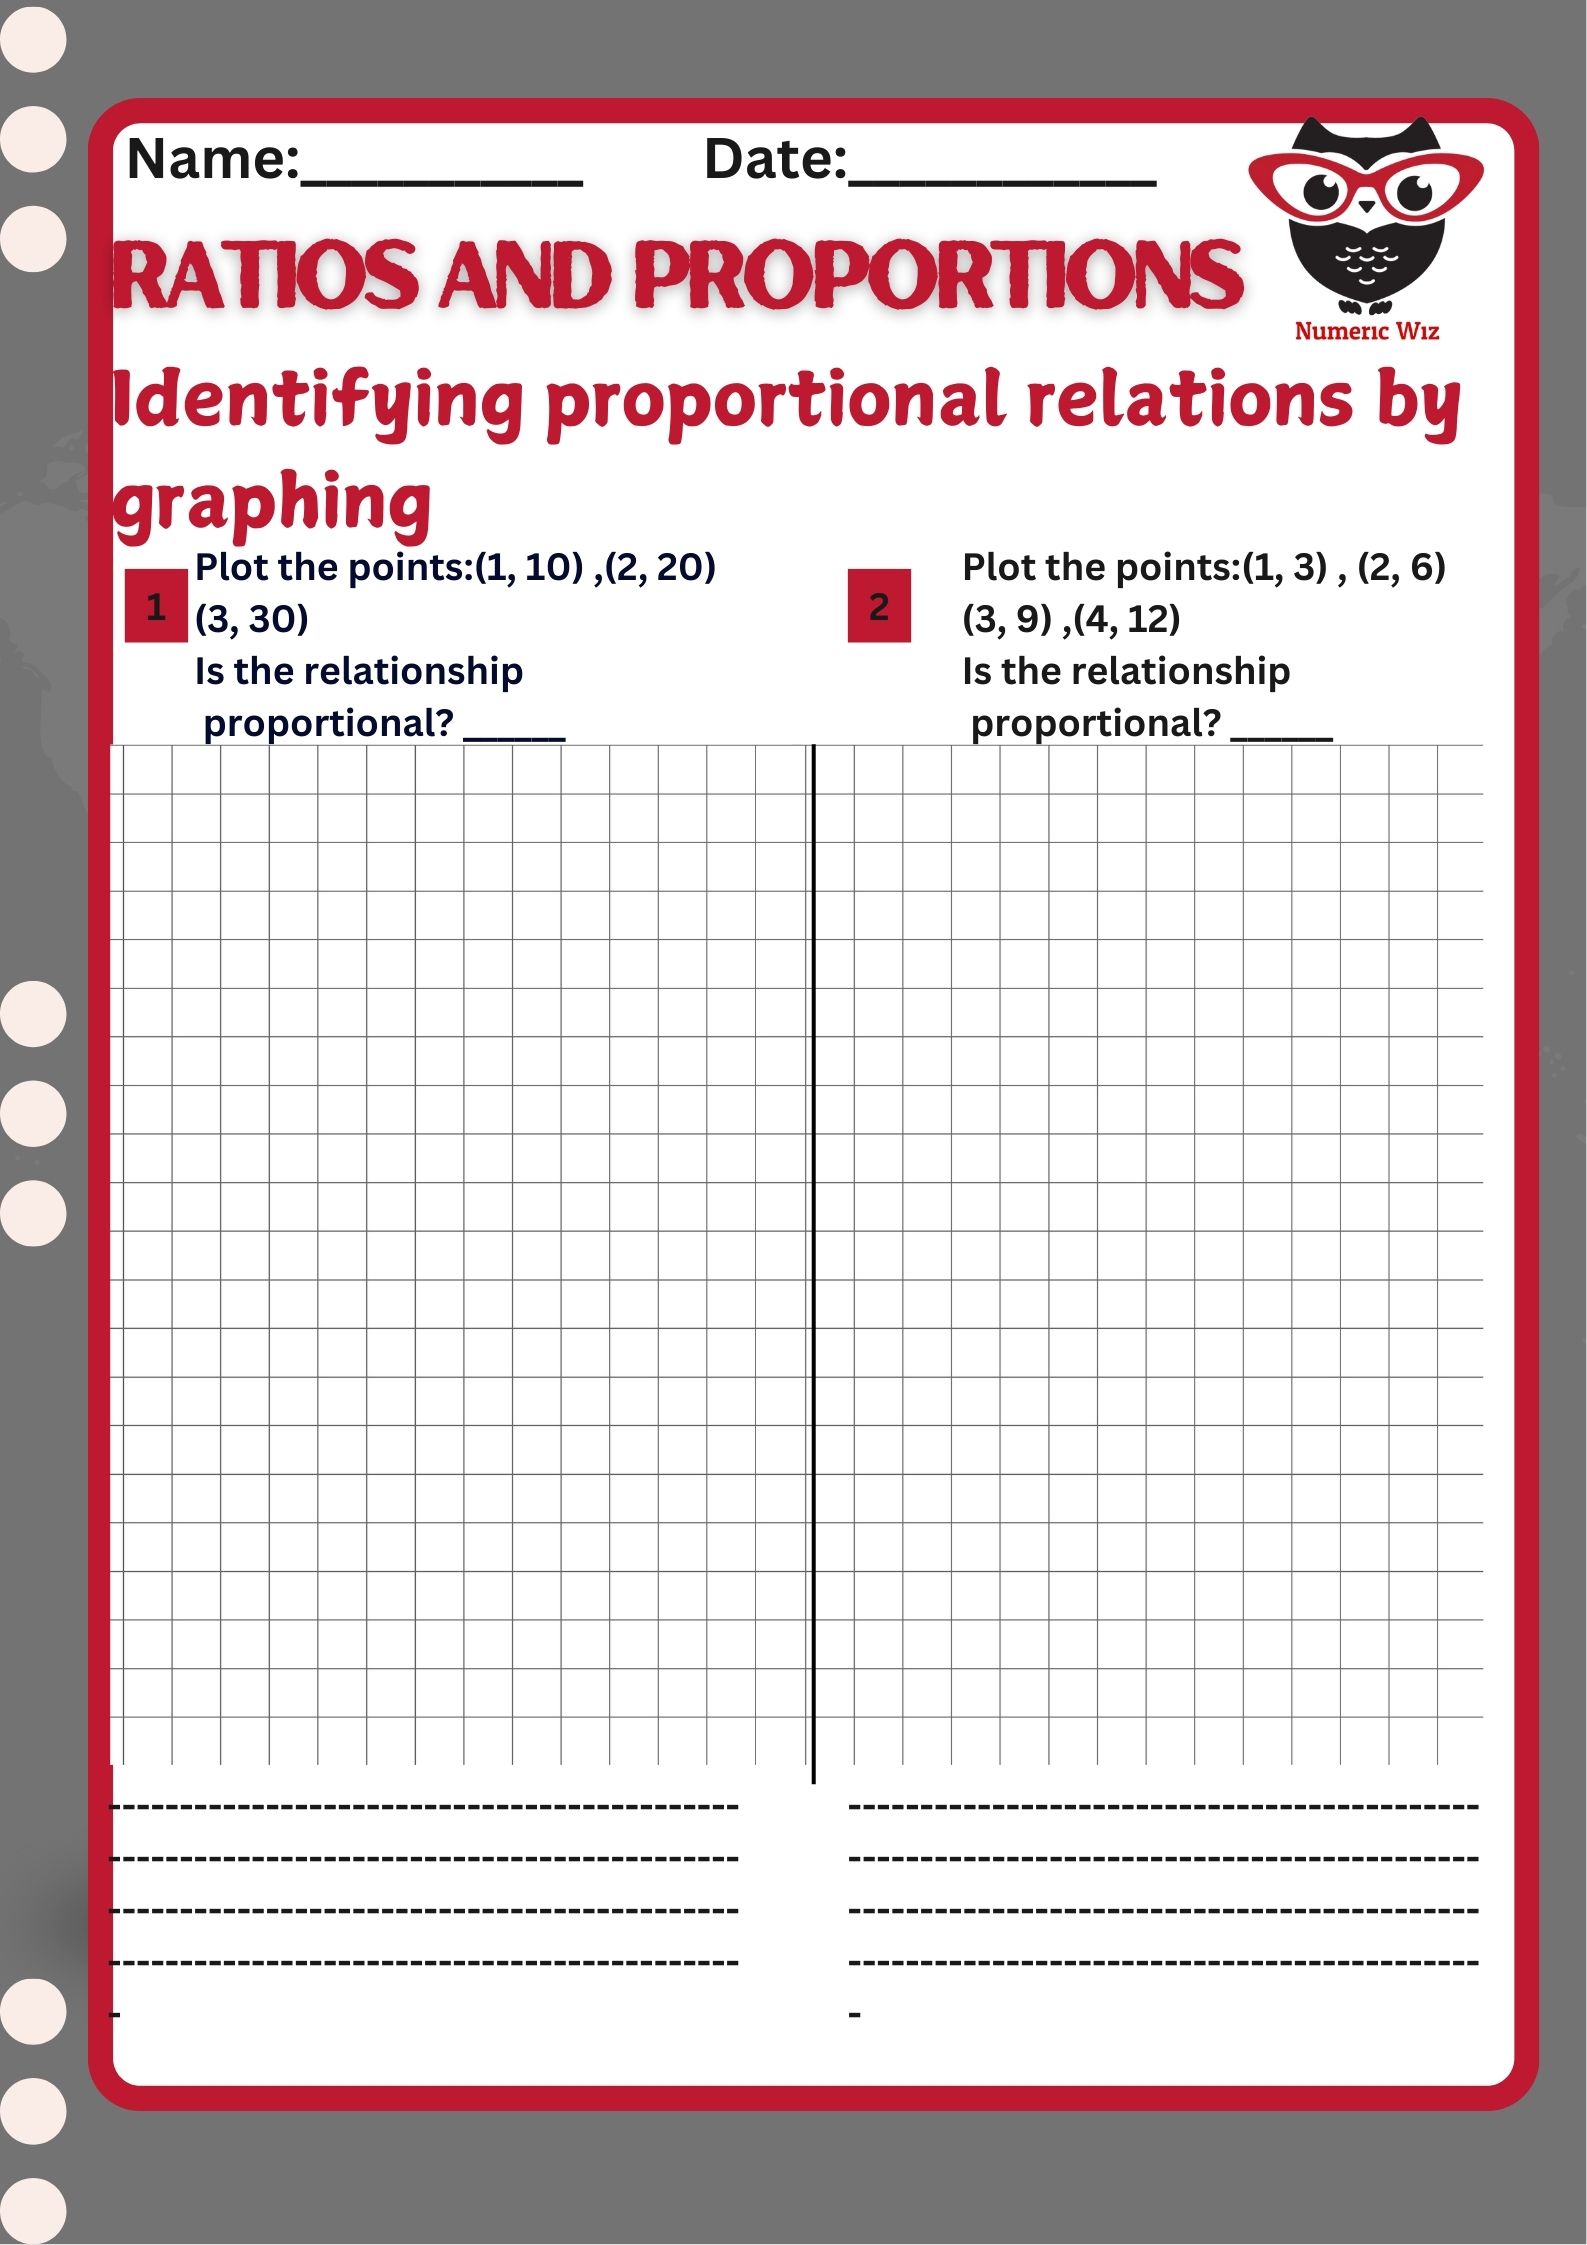
  1. Plot the points on a graph.

  2. Check the line: Do the points lie on a straight line?

  3. Check the origin: Does the line go through the point (0, 0)?

 All three points lie on a straight line.
 The line also passes through the origin.

 Yes, the relationship is proportional!

Here's the graph:

Let’s Try Another One:

Question:
Plot the points: (1, 3), (2, 6), (3, 9), (4, 12).
Is this relationship proportional?

Solution:

  1. The line formed is straight

  2. It goes through the origin

 Yes, this relationship is also proportional.

Here's the graph for this too:

Did You Know?

  • A proportional relationship always forms a straight line that goes through the origin.

  • The steepness of the line shows the constant of proportionality (or unit rate).

  • This is useful in real life for comparing prices, speeds, and recipes

Premium Membership

whats inside Premium package

$0/per month

For a limited time

All Answer Keys
An Ad-free Experience
Premium/Full Screen PDFs
Unlimited Access

More Similar Worksheets

7g17
 Identify Proportional Relationships from Tables
4g7
Unit Rates (Additional Practice )
7g14
Identifying Proportional Relationships by Graphing
5g7
Identifying Equivalent Ratios
To download this worksheet collection, select the bellow option either to Login or Register (it only takes a minute) and you’ll be brought right back to this page to start the download!
  • Sign Up
Lost your password? Please enter your username or email address. You will receive a link to create a new password via email.