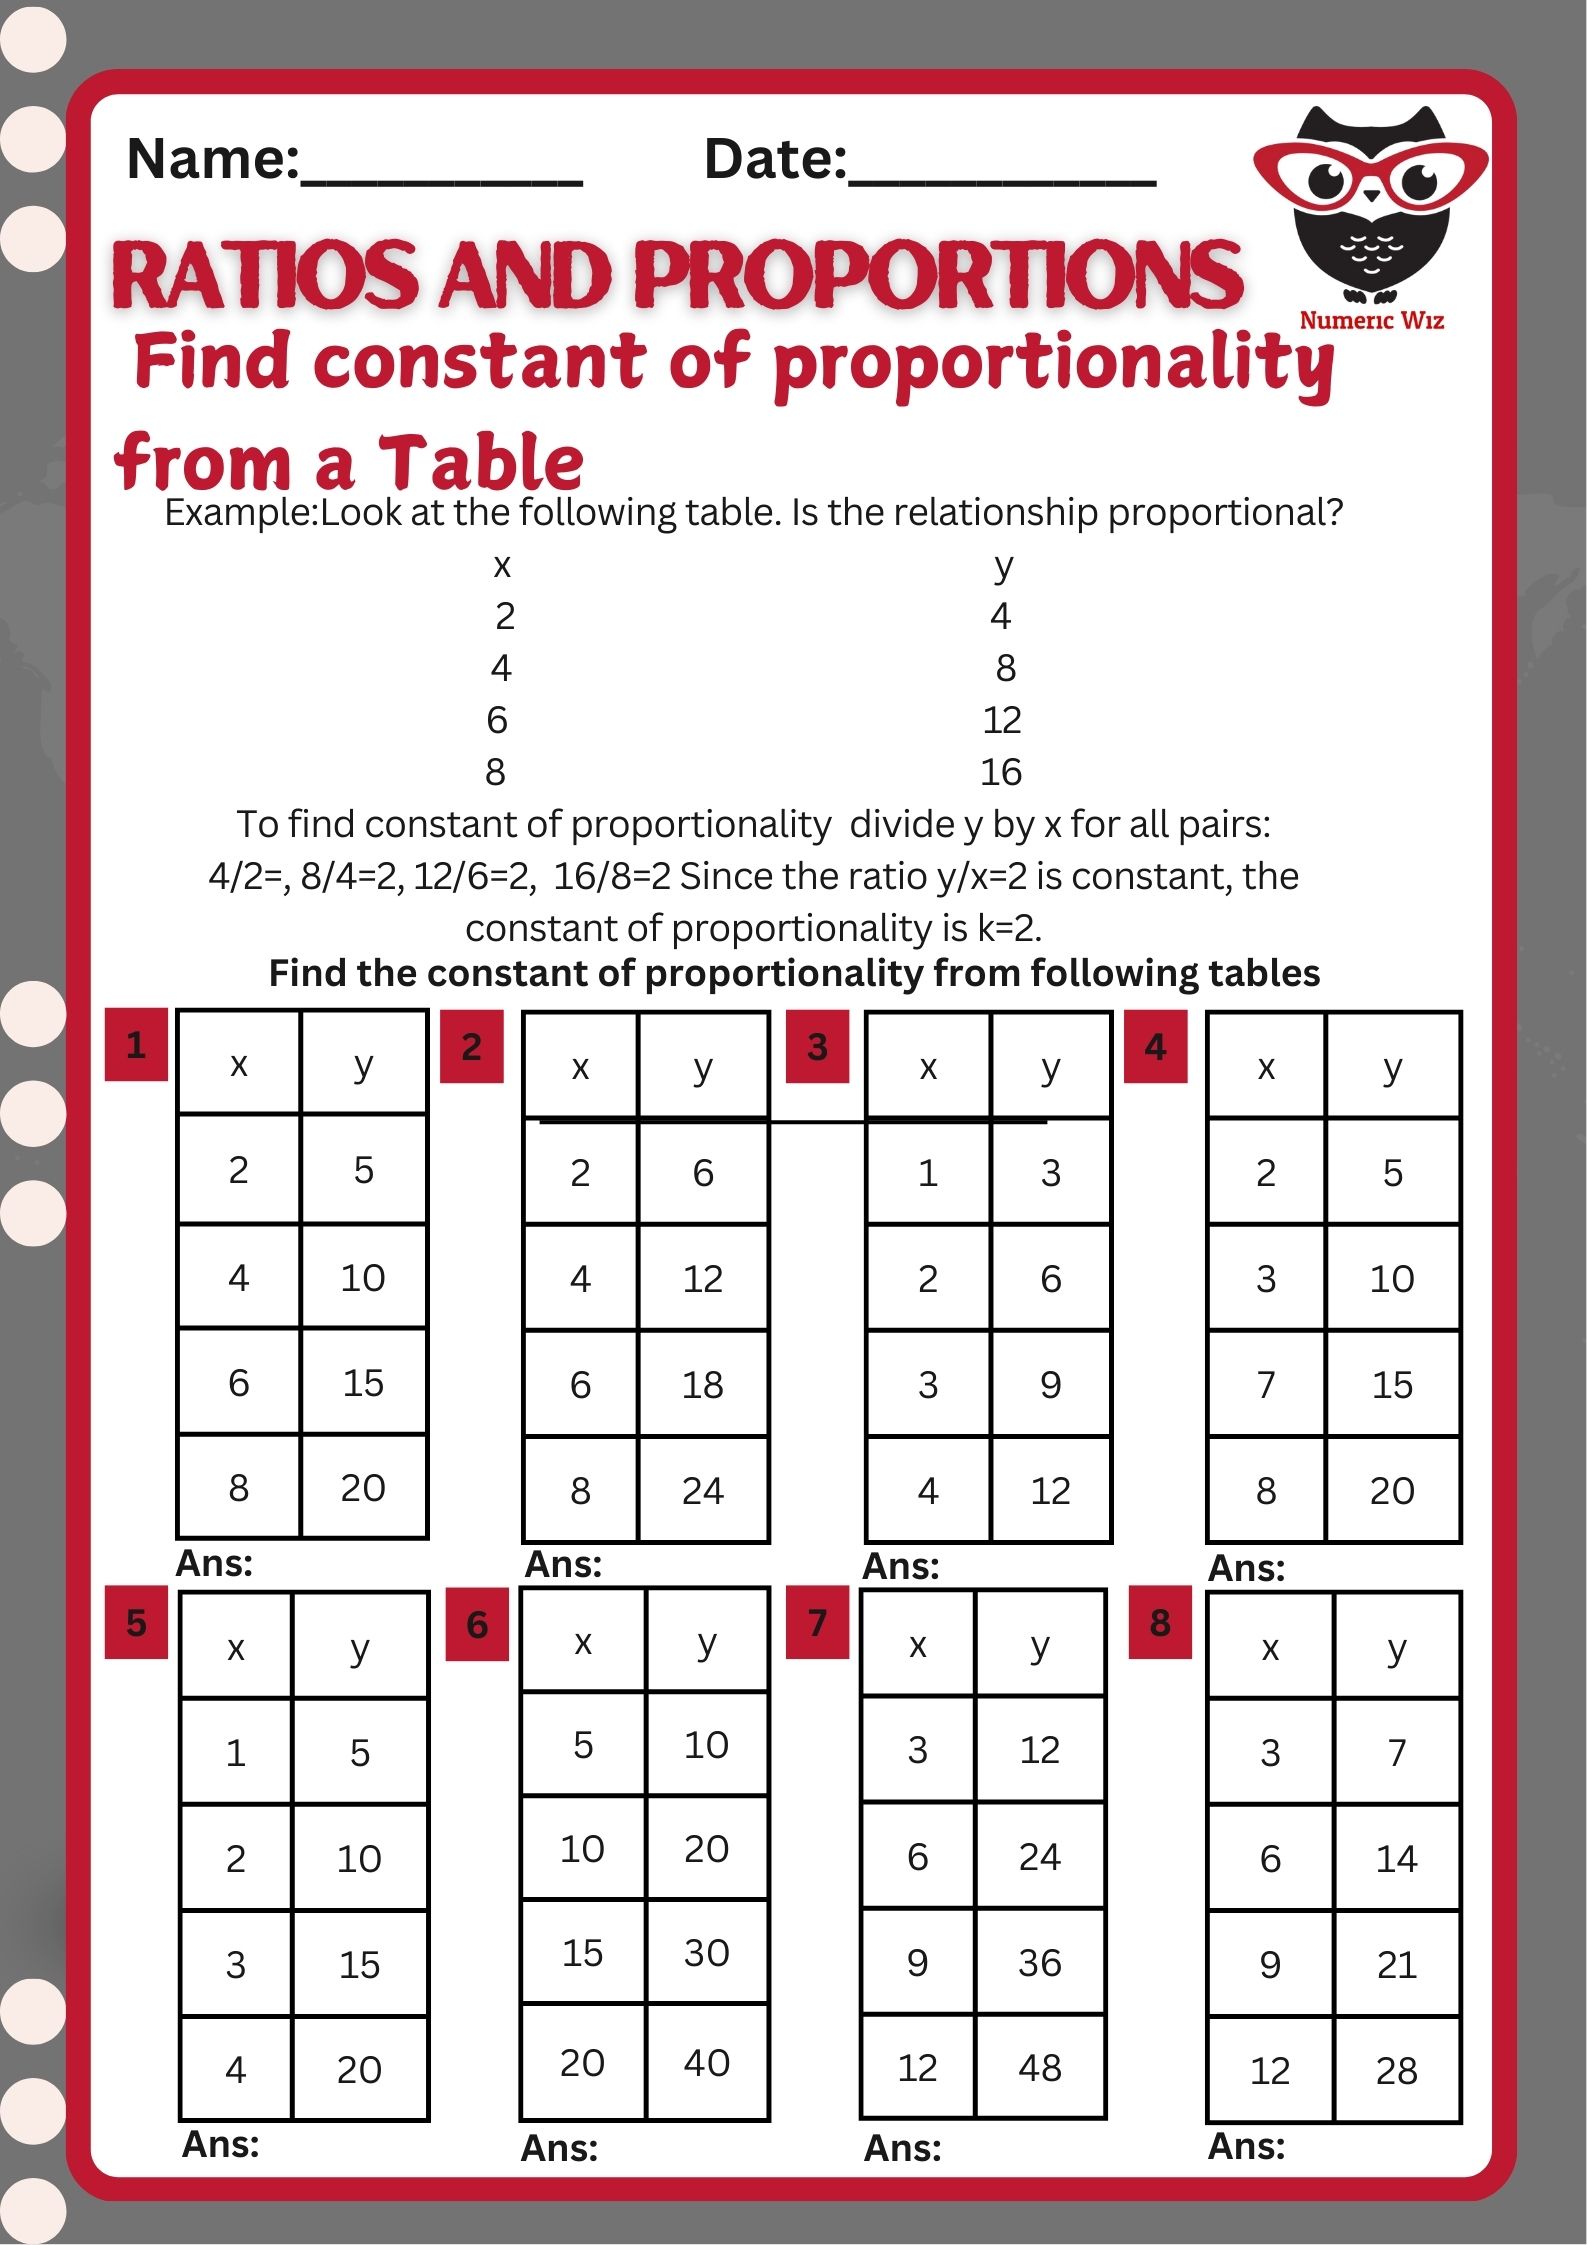
Have you ever noticed how some things increase at the same rate? Like buying more apples costing more money, or running more minutes covering more distance? These are examples of proportional relationships. In math, we can figure out if a relationship is proportional by looking at a table — and the key is finding the constant of proportionality.
 What is the Constant of Proportionality?
When two quantities increase or decrease at the same rate, they are in a proportional relationship. That means their ratio always stays the same. This fixed ratio is called the constant of proportionality, or k.
To find k, simply divide the y-value by the x-value in the table:
If all the pairs in the table give the same value of k, then the relationship is proportional!

| x | y |
|---|---|
| 2 | 4 |
| 4 | 8 |
| 6 | 12 |
Step 1: Divide y by x for each pair:
4÷2=2
8÷4=2
12÷6=2
Since the result is the same for all pairs, this table is proportional, and the constant of proportionality is 2.
 What’s in the Worksheet?
One example problem with easy-to-follow steps
10 tables for practice
Each table helps you discover whether it’s proportional and what k is
Designed for Grade 7 students who are learning about ratios and proportions
Let’s practice and evaluate your work together by adding 3-digit numbers.