Introduction – What Are You Learning?
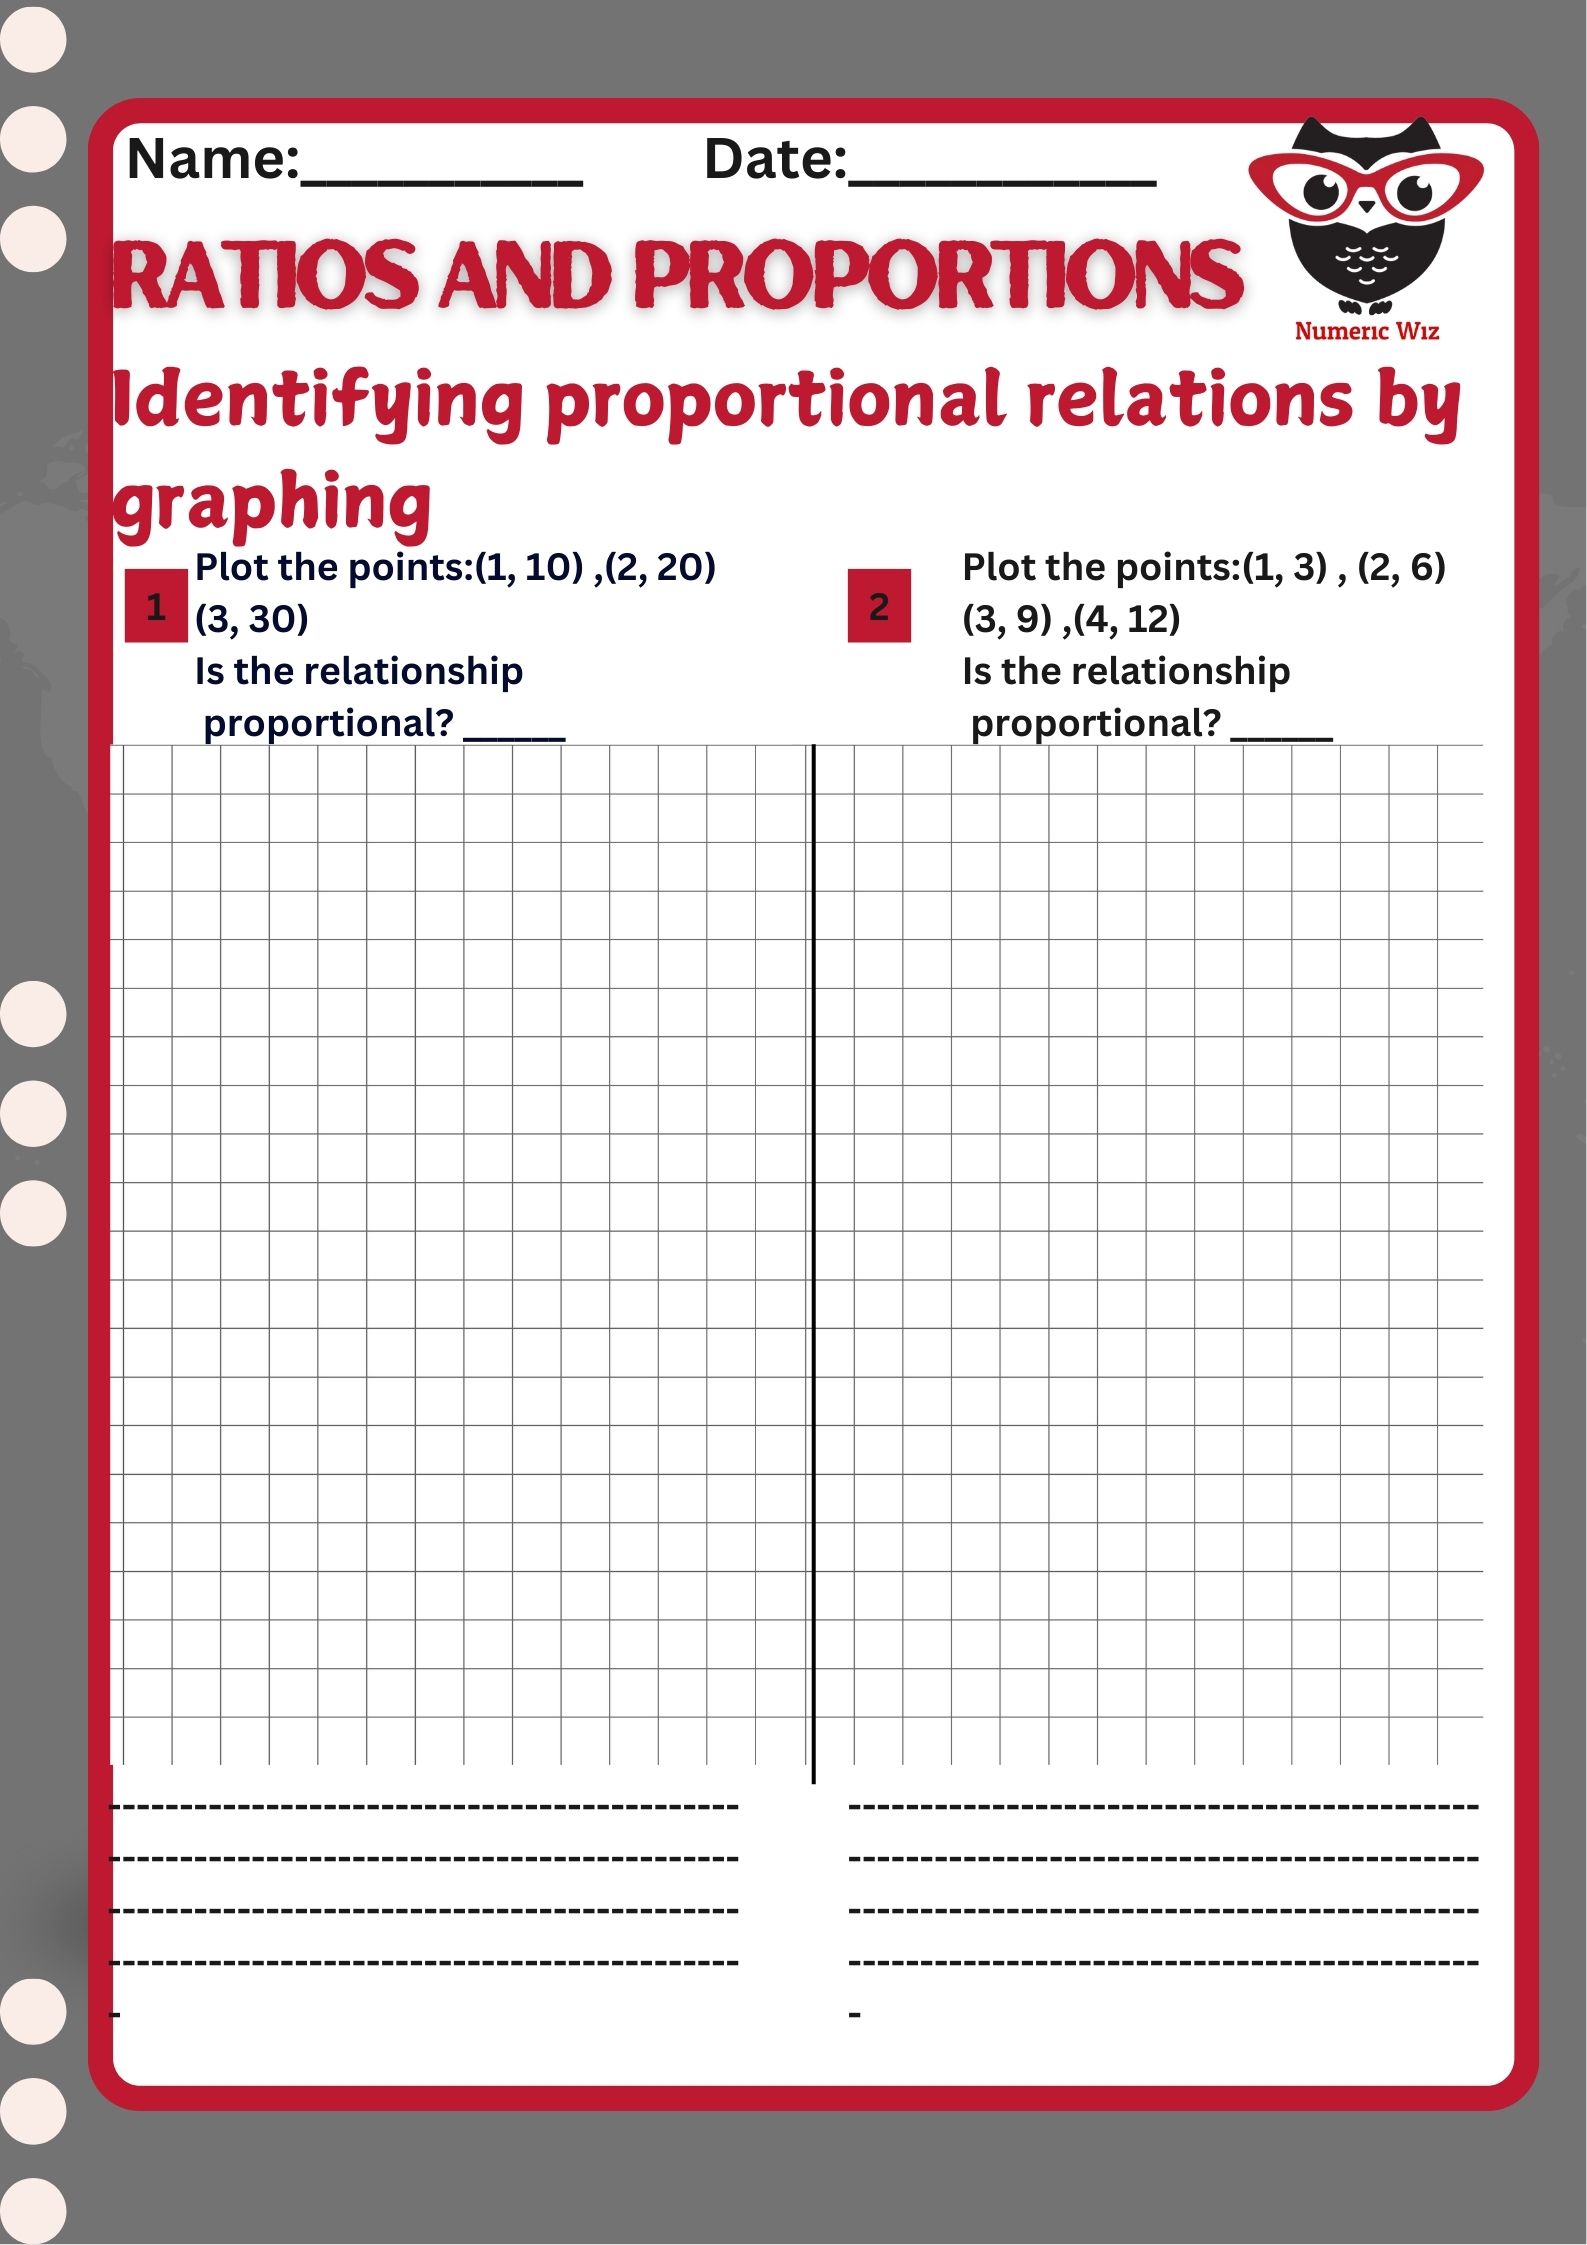
This worksheet is all about ratios and proportions—two math ideas that help us compare things. You'll learn how to look at a graph and write an equation that shows the relationship between two things. If the graph is a straight line that starts at (0, 0), it means the relationship is proportional.
We use the special equation y = kx. This just means:
-
y is the total,
-
x is the number of items or time,
-
and k is the same number you multiply by every time (this is called the constant of proportionality).
This sheet helps you see the relationship in a graph and write it in math language. It’s great for 6th and 7th graders who are starting to connect graphs and equations!
Solved Example
Question:
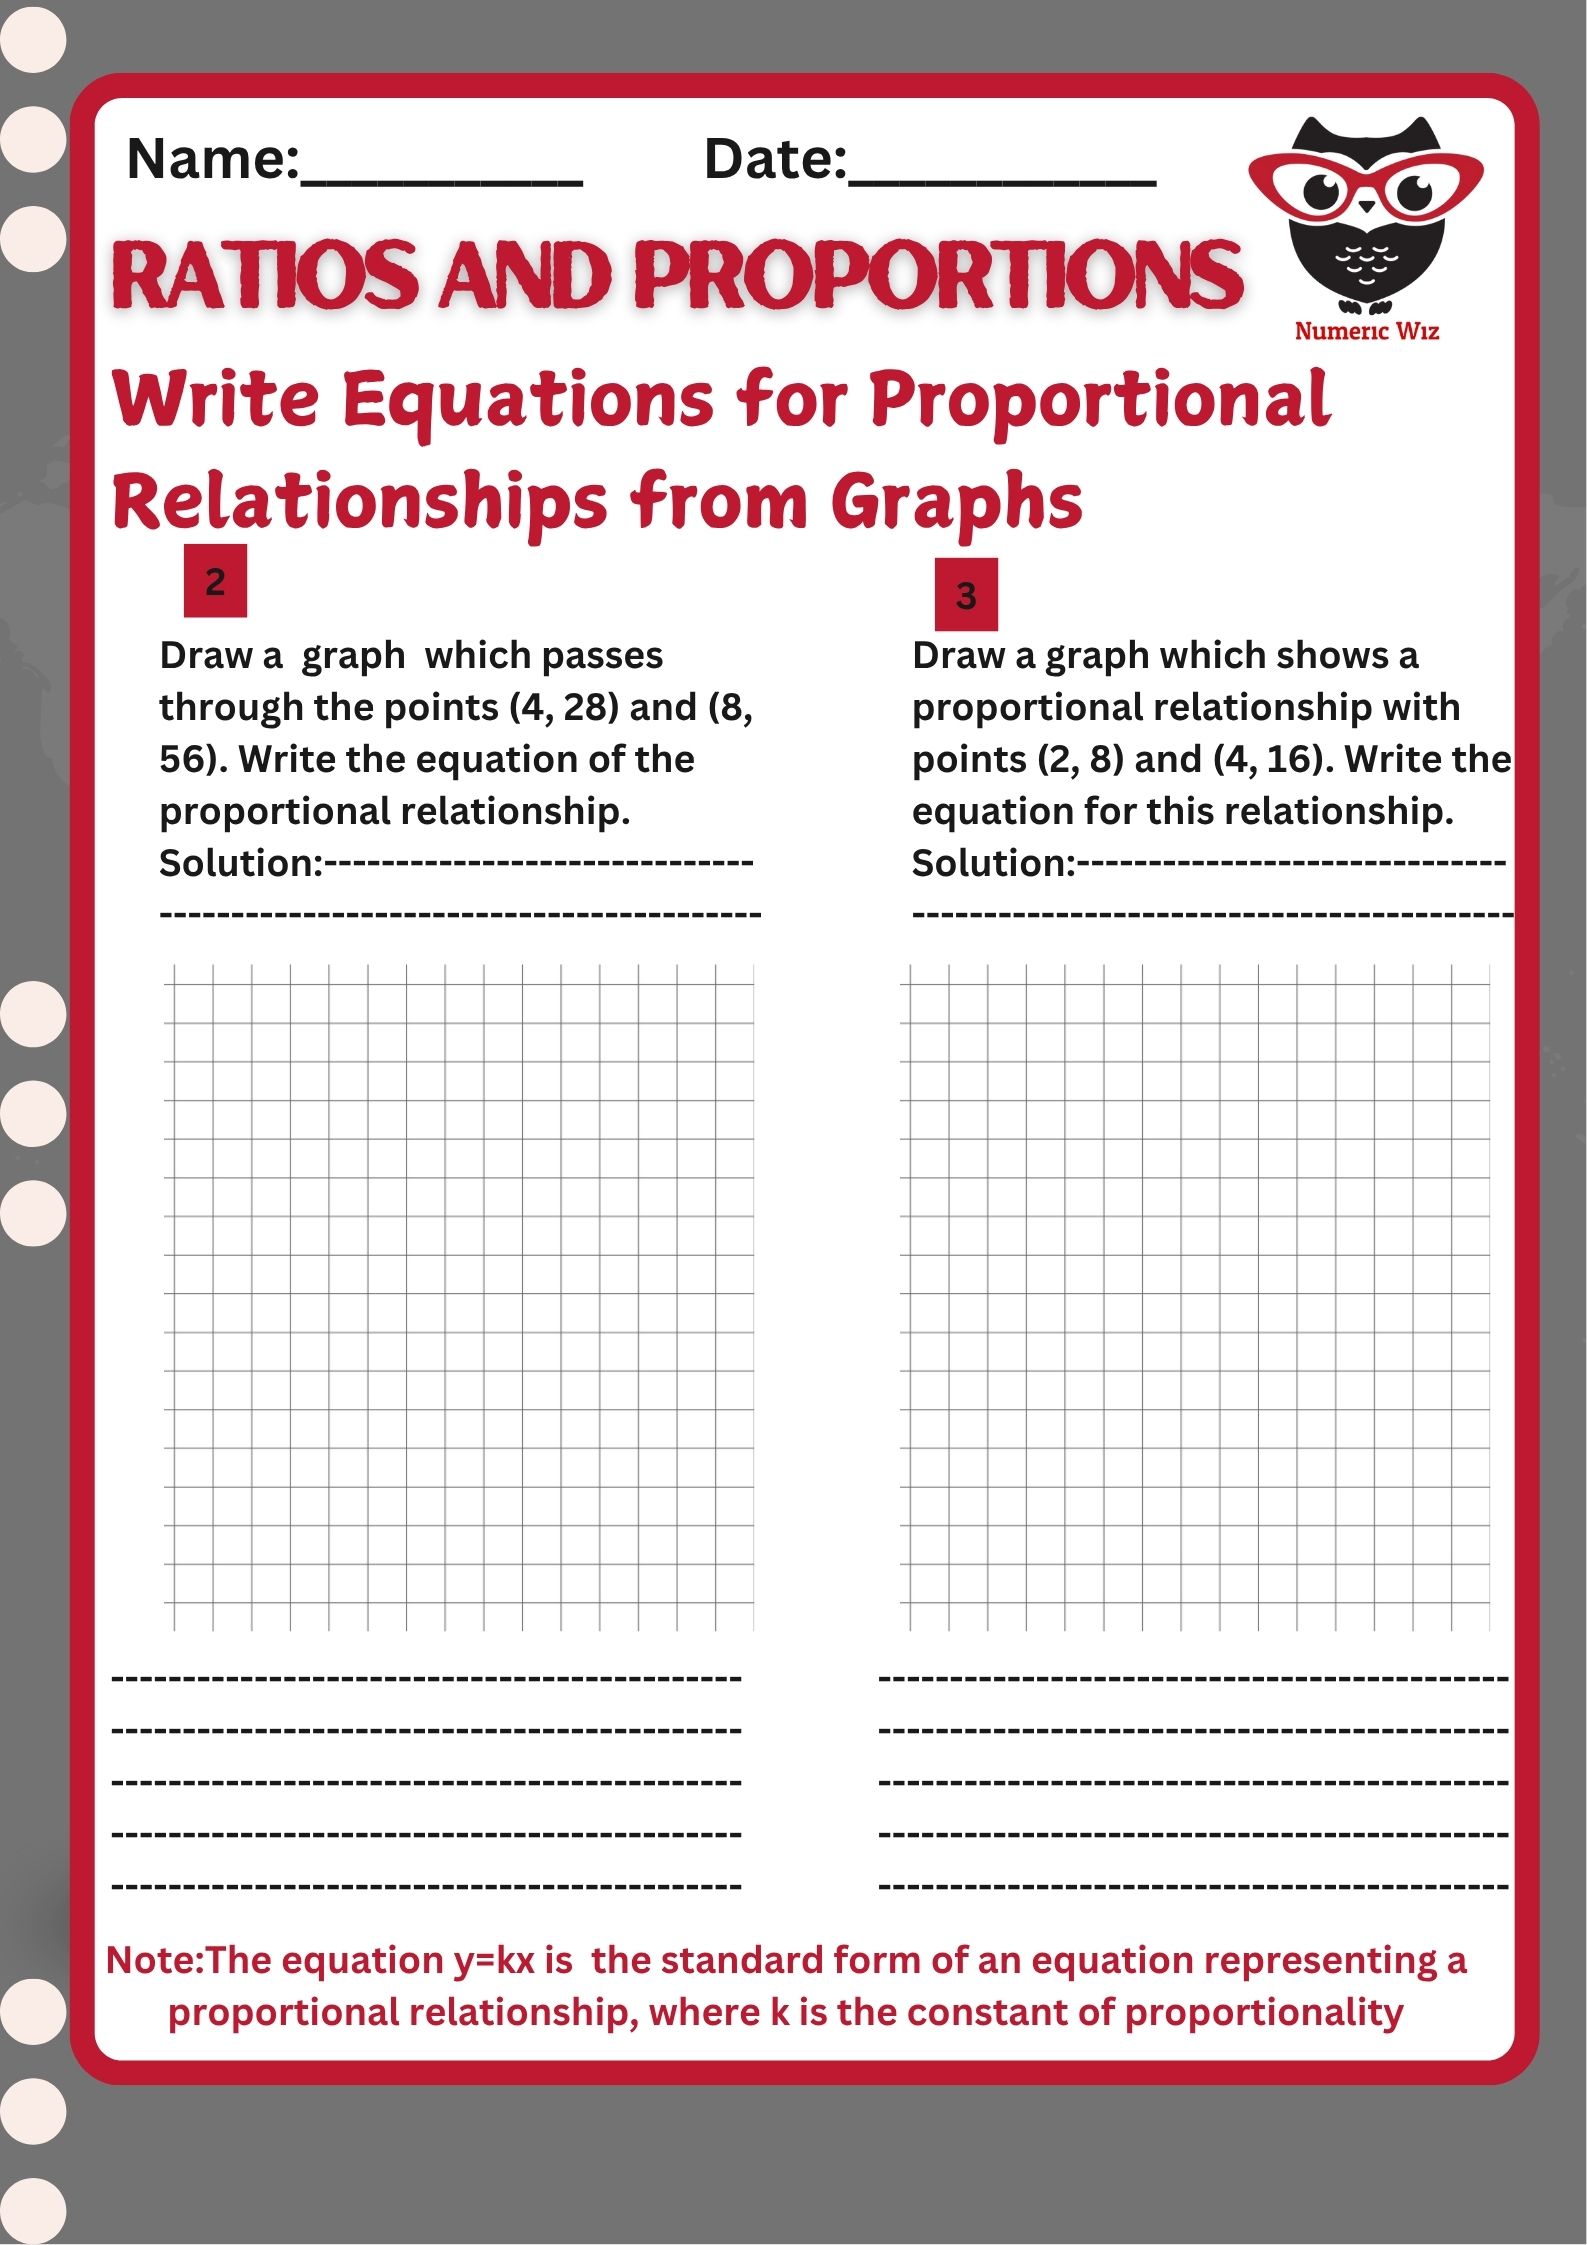
Draw a graph which passes through the points (4, 28) and (8, 56). Write the equation of the proportional relationship.
Solution:
Step 1: Identify two points: (4, 28) and (8, 56)
Step 2: Find the constant of proportionality (k) using the formula:
Step 3: Write the equation of the relationship using the form y = kx:
y=7x
Explanation:
This means for every 1 unit increase in x, y increases by 7. So the equation y = 7x represents the proportional relationship shown by the graph passing through the given points.

Here is the graph for the solved example showing the proportional relationship y = 7x.
-
The line passes through the points (4, 28) and (8, 56).
-
The dashed line extends the proportional pattern, showing that the relationship is linear and starts from the origin (0, 0).
This visual makes it easy to understand how two points on a graph can help us write the equation of a proportional relationship.
Final Note for Students & Teachers
This worksheet makes a sometimes tricky topic super simple. By drawing graphs and solving with easy steps, students get to see how math connects to everyday life. Whether you’re a student needing extra practice or a teacher looking for a quick review activity, this sheet is a great resource to strengthen understanding of proportional relationships.
Equip your classroom with this engaging, standards-aligned worksheet to turn graph-reading into algebra mastery and watch your students discover the power of proportional reasoning!