Understanding percent problems becomes much easier with the help of grid models. These visual tools allow you to break down percentages into simple, clear parts, making complex problems feel intuitive. Whether you’re finding a percentage of a quantity, calculating a discount, or determining the whole when given a part and the percent, grid models provide a hands-on way to visualize math.
Grid models simplify the concept of percentages by representing them visually as parts of a 100-square grid. Each square in the grid corresponds to 1%, helping students connect abstract numbers to concrete visuals. This approach is especially helpful for beginners or anyone looking to strengthen their understanding of percentages.
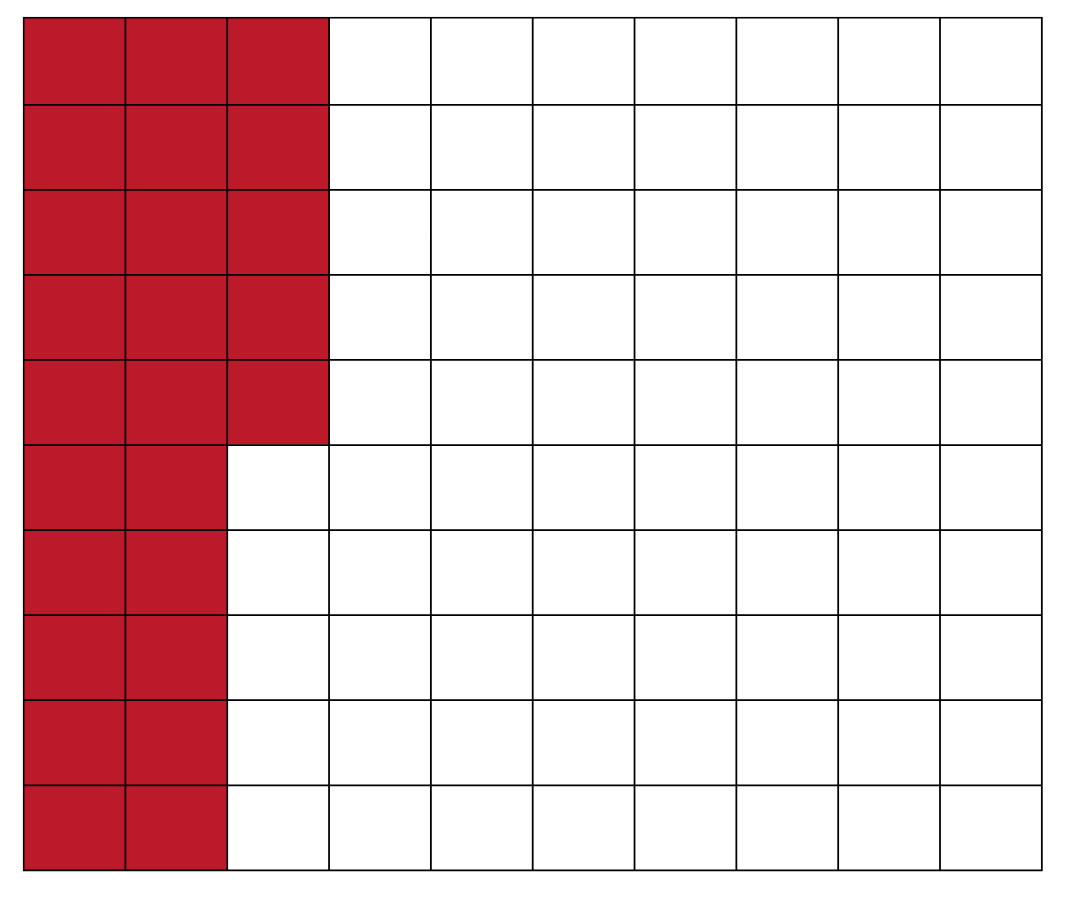
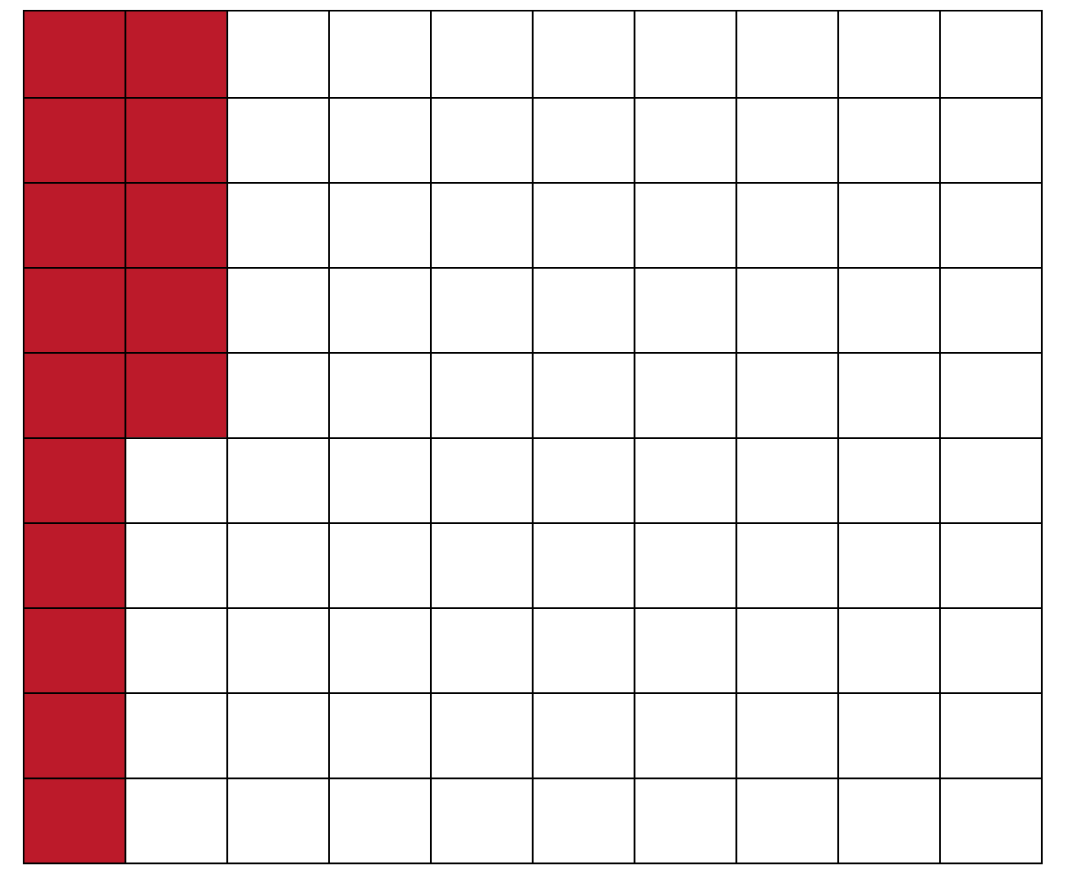
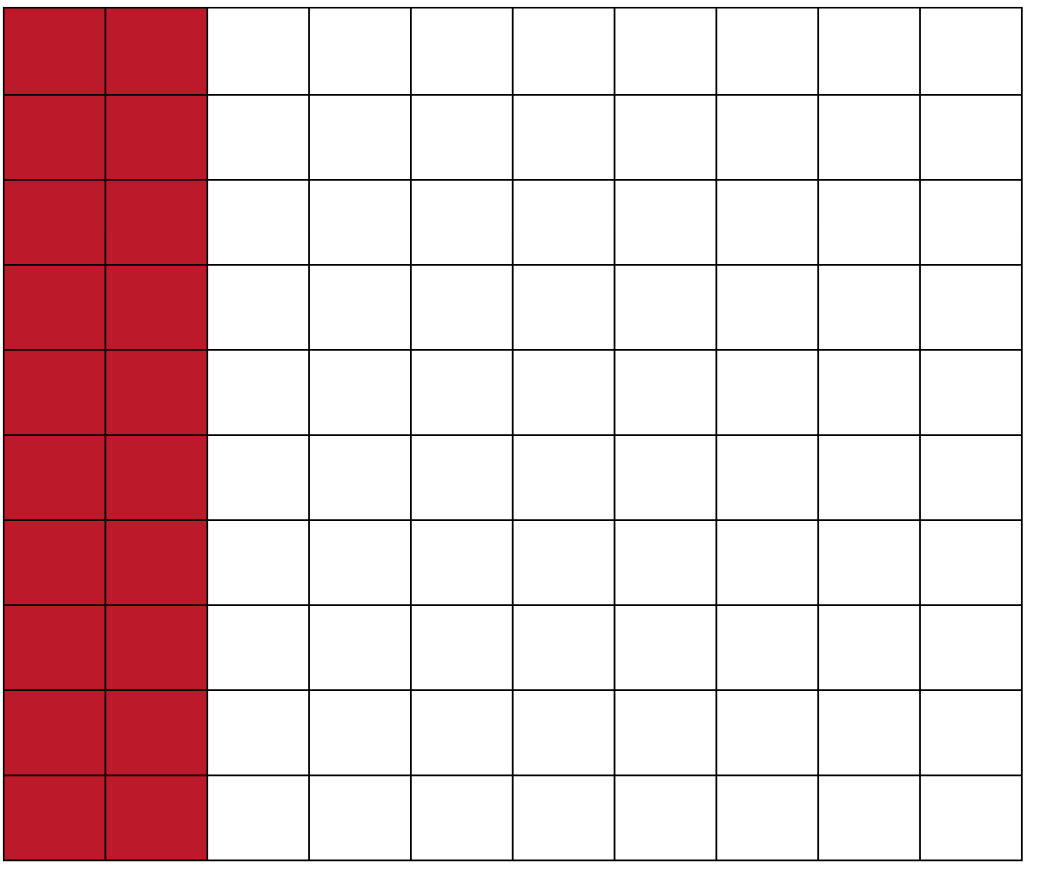
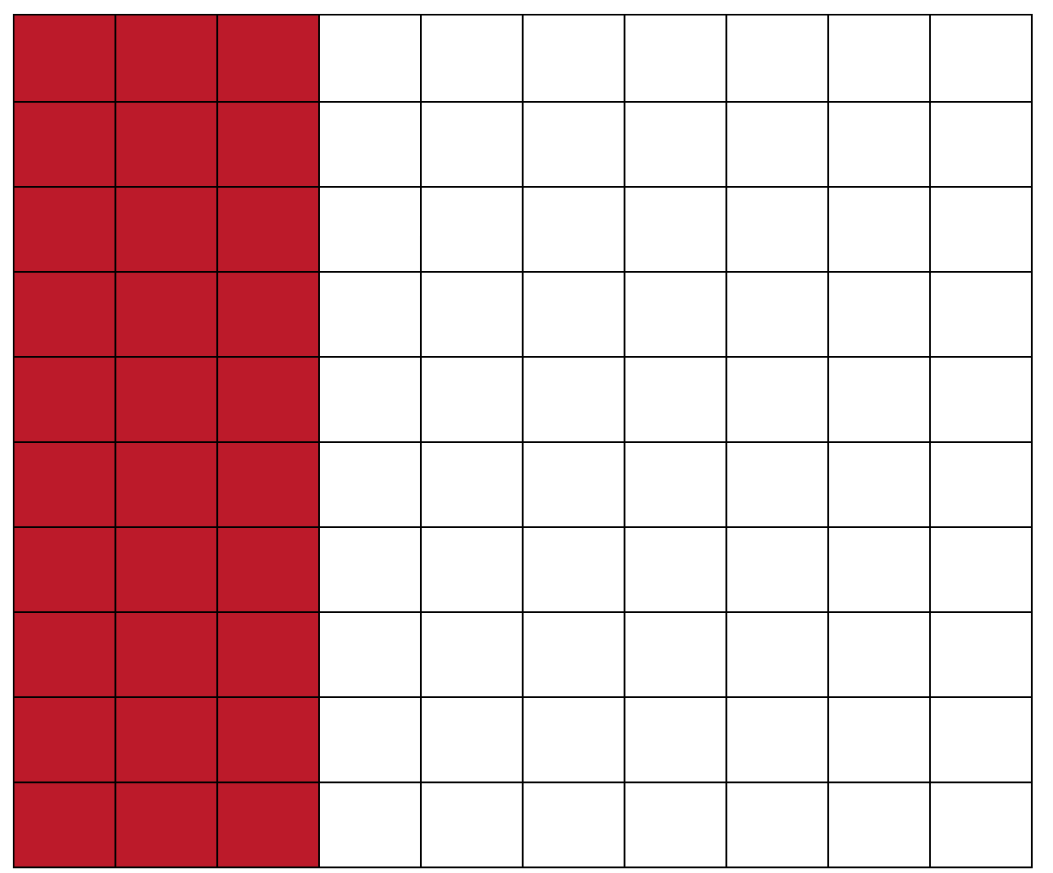
Representing Percentages:
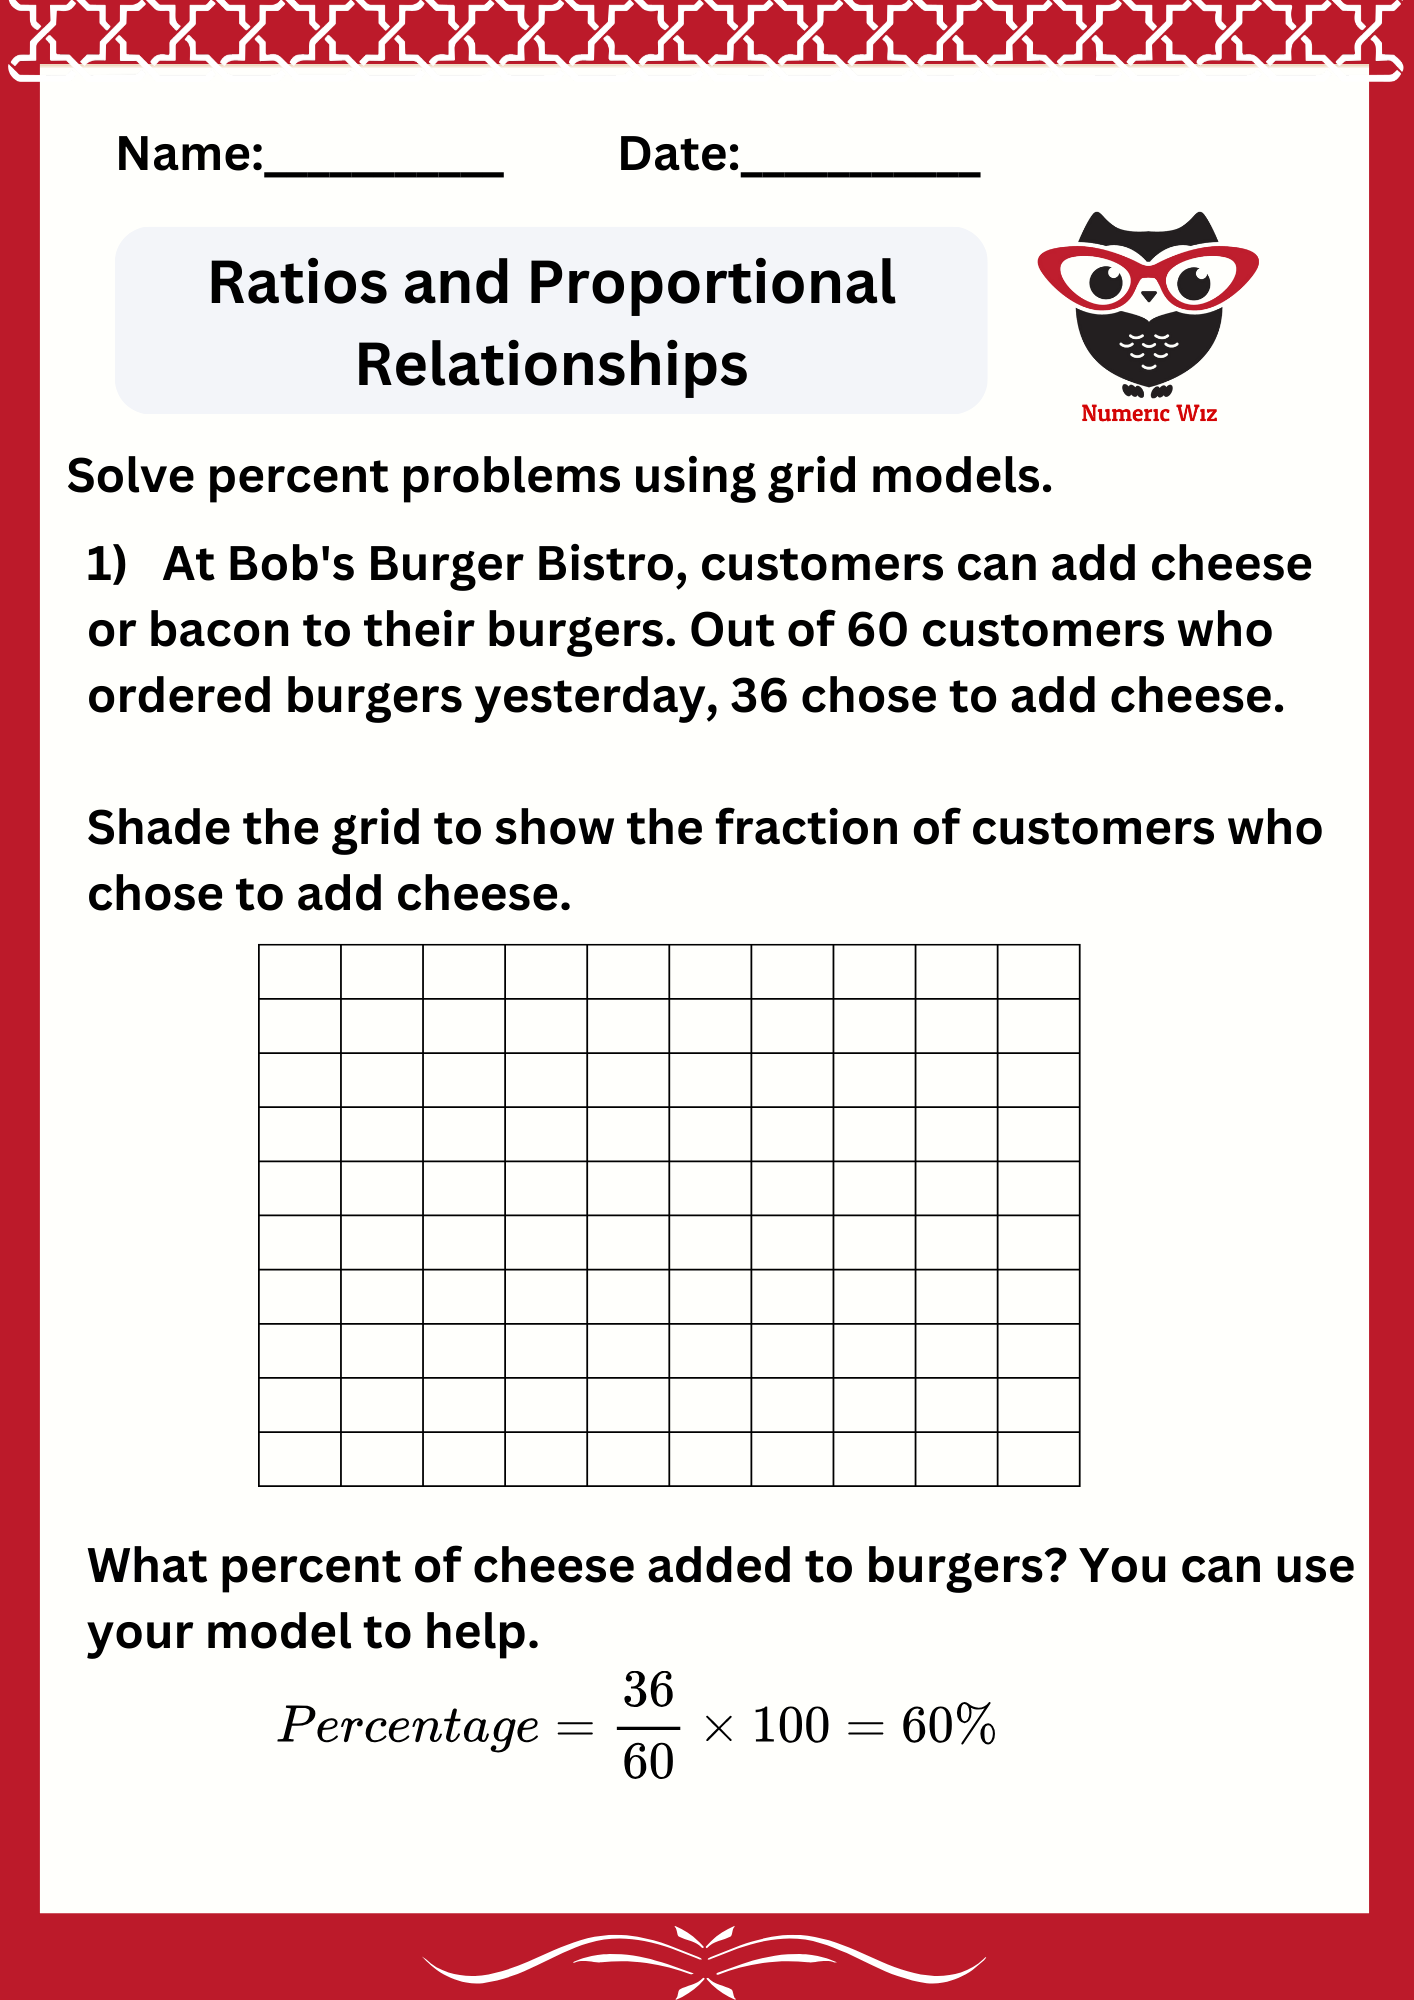
Shade the grid to show the given percentage. For example, shading 30 squares represents 30%.
Finding a Part of a Quantity:
Multiply the total quantity by the percentage as a decimal or fraction. The shaded portion of the grid corresponds to the part.
Finding the Whole:
Use the grid to estimate or calculate the total based on the part and percentage.
Comparing Percentages:
Use multiple grids to visualize and compare different percentages of the same or different quantities.
Find a Percent of a Quantity:
Problem: What is 40% of 50?
Solution: Shade40 squares on a 100-grid. Each square represents 0.5 (since 50 ÷ 100 = 0.5). The total shaded value is 20×0.5=10.
Find the Whole Given a Part and Percent:
Problem: If 15 represents 25% of a quantity, what is the total?
Solution: Shade 25 squares to represent 25%. Each square equals
15÷25=0.6. The total is 0.6×100=60.
Compare Percentages:
Problem: Compare 30% of 40 to 50% of 40.
Solution: Use two grids. Shade 30 squares for the first and 50 squares for the second. Visualize that 30 and 50.
Example : Find a Percent of a Quantity
Problem: A school has 120 students. If 25% of them are in the art club, how many students are in the club?
Solution:
Convert the percent to a fraction or decimal:
25%=25/100=0.25.
Multiply by the total:120×0.25=30.
Answer: 30 students are in the art club.
With Grid Model:
Use a 100-square grid to shade 25 squares, representing 25%.
If each square represents 120÷100=1.2, multiply 1.2×25=30.
Example: Find the Whole Given a Part and Percent
Problem: A charity collected $45, which is 15% of their target goal. What was the total goal?
Solution:
Convert the percent to a decimal: 15%=0.15.
Use the formula:
Total Goal=Part/Percent
Total Goal=45/0.15=300
Answer: The total goal was $300.
With Grid Model:
Shade 15 squares for 15% on the grid.
If the shaded portion represents $45, then each square is
45÷15=3.
Multiply by 100 squares:3×100=300.
Example : Compare Percentages
Problem: A store offers two discounts: 20% off $50 and 30% off $40. Which is the better deal?
Solution for 20% of $50: 50×0.20=10.
Discounted price: 50−10=40.
Solution for 30% of $40:
40×0.30=12.
Discounted price: 40−12=28.
Answer: The 30% discount on $40 gives the better deal.
With Grid Model:
For 20%, shade 20 squares, with each square representing
50÷100=0.5.
Total discount:0.5×20=10.
For 30%, shade 30 squares, with each square representing
40÷100=0.4.
Total discount: 0.4×30=12.
Visual Clarity: Grids simplify abstract numbers by turning them into easy-to-see parts.
Hands-On Learning: Encourages interactive and engaging problem-solving.
Improved Accuracy: Reduces errors by providing a clear visual representation of the math.
Builds Confidence: Makes even complex percent problems accessible and manageable.
Start practicing percent problems with grid models today! From basic calculations to solving real-world scenarios, these visual tools will help you build a solid foundation in percentages while making math more enjoyable.
Let’s dive into solving percent word problems with confidence and make math practical and fun with real-life scenarios!